Habenulo-interpeduncular pathway: 4 mapping methods
The habenulo-interpeduncular pathway is a compact tract with an unusually large interpretive burden.
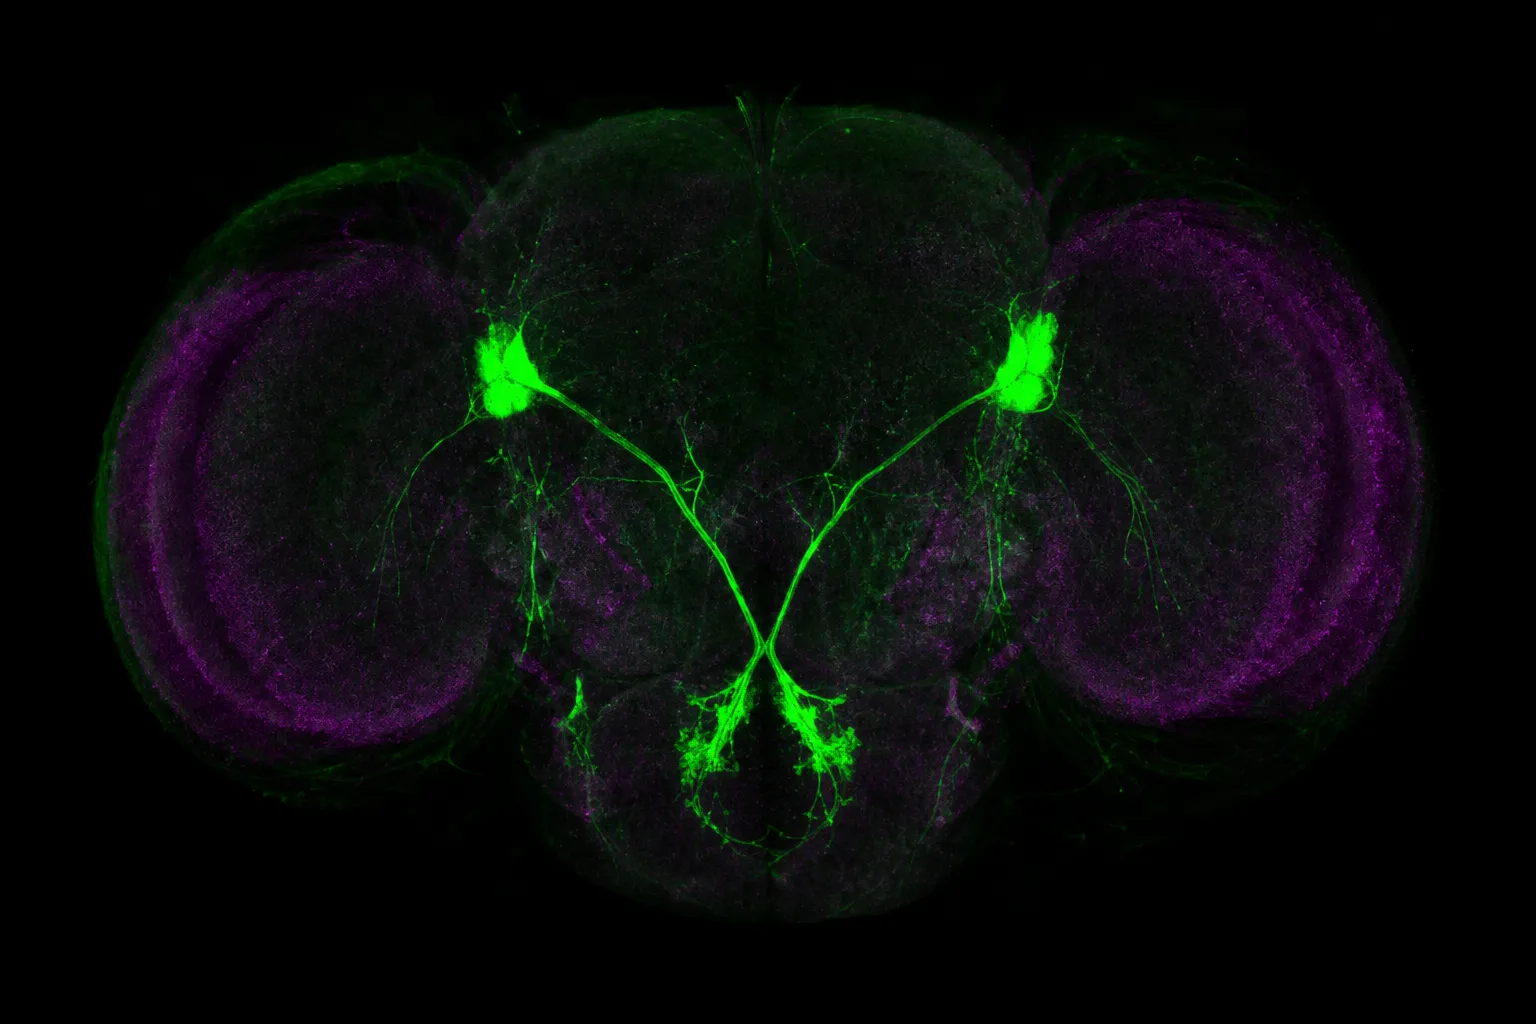
In zebrafish, the connection is only a few millimeters long, yet its left–right organization, developmental timing, neurotransmitter profile, and subnuclear targets cannot be captured by a single image or a single tracing technique. A fluorescent axon tells us where a fiber travels. It does not, by itself, tell us whether the fiber forms a functional synapse, which neurons receive it, or how that connection changes behavior.
That is why mapping the habenulo-interpeduncular tract requires several complementary methods. Chemical tracers reveal broad anatomical routes. Viral tools resolve trans-synaptic organization. Photoconvertible reporters make developmental movement visible in living zebrafish tissue. Optogenetic mapping adds physiological evidence, while diffusion MRI and ultra-high-field imaging extend the question to the human brain.
The most useful distinction is not between “old” and “new” methods. It is between the layers of circuit architecture each method can actually see.
A pathway map is never just a line between two nuclei. It is a record of origin, direction, timing, synaptic transfer, and functional consequence.
What the pathway map needs to distinguish
The habenulo-interpeduncular pathway links the habenula with the interpeduncular nucleus through the fasciculus retroflexus. In developmental and circuit studies, researchers are usually trying to resolve several different questions at once:
- Where do the axons begin? The medial and lateral habenular nuclei are not interchangeable sources.
- Which route do they take? Developmental fibers may follow atypical trajectories before reaching their mature position.
- Where do they terminate? The interpeduncular nucleus contains subnuclei with distinct connectivity.
- Is the connection direct? A visible projection is not automatically proof of a functional monosynaptic contact.
- When does the tract form? Developmental timing can be as informative as adult anatomy.
- Does the pathway differ across the left and right sides? Zebrafish habenular circuitry is notably asymmetric, so a mirrored diagram can conceal biologically important organization.
- What does the pathway do? Synaptic physiology and behavioral manipulation are needed to move from structure toward function.
These questions explain the continued use of multiple mapping methods. Each technique produces a different visual grammar: colored axons, converted cell bodies, viral labels, recorded currents, or tractography streamlines. The challenge is to avoid treating those images as equivalent.
A dense fluorescent bundle and a clean MRI streamline may both look like “the tract.” They are not the same kind of evidence.
1. Chemical and viral tracing: from route to connectivity
Chemical tracers establish the anatomical scaffold
Conventional tract tracing remains valuable because it answers a basic question with relatively direct visual evidence: where does the projection go?
Lipophilic dyes such as DiI can be applied to fixed tissue and diffuse along neuronal membranes. Retrograde tracers such as horseradish peroxidase have also been used historically to identify neurons that project back toward an injection site. These approaches helped define the topographic organization of the habenulo-interpeduncular pathway across species, including the laterotopic patterning that is especially important in zebrafish.
The strength of chemical tracing is its anatomical transparency. A labeled pathway can be followed through the tissue, and the result is often easier to interpret than a complex genetic or viral experiment. It is also useful when the immediate aim is to establish whether a projection exists at all.
Its limitation is equally clear. A tracer can reveal an axonal route without resolving every synaptic partner along that route. It may show that a habenular population reaches the interpeduncular region, but not how the terminals are distributed among individual interpeduncular subnuclei or whether a labeled neuron belongs to a reciprocal circuit.
For a first-pass map, this is not a weakness to hide. It is a boundary to label.
Viral tracing adds direction and trans-synaptic structure
Viral-based methods can move the map from “fiber bundle” toward “network.” Tools such as CAV2-Cre, rabies virus, and vesicular stomatitis virus have been used to identify precise reciprocal connections and to examine subnuclear organization between the medial habenula and the interpeduncular nucleus.
The conceptual advantage is that viral tracing can be designed around directionality. A retrograde strategy may reveal neurons that project into a chosen target. A trans-synaptic approach can extend the label across synaptic relationships, helping researchers reconstruct the local partners surrounding a defined population.
This is particularly useful when the question is not simply whether the habenula connects to the interpeduncular nucleus, but how the connection is arranged:
1. A defined neuronal population is selected as the starting point or target.
2. A viral vector carries a genetic or fluorescent label through the experimental circuit.
3. The resulting pattern is read across anatomical sections.
4. Researchers compare labeled cell groups, projection zones, and subnuclear distributions.
5. The map is then checked against independent anatomical or physiological evidence.
The visual result can be strikingly precise, but precision should not be confused with completeness. Viral labeling depends on the vector, promoter, injection geometry, timing, and the biological properties of the tissue. A missing label may indicate a genuine absence of connectivity, or it may reflect limited access to a cell population.
Chemical versus viral tracing
| Question | Chemical tracing | Viral trans-synaptic tracing |
|---|---|---|
| Primary strength | Defines the broad anatomical route | Resolves directed and synaptic relationships |
| Typical readout | Labeled axons or retrogradely labeled neurons | Genetically or fluorescently labeled circuit partners |
| Best suited to | Establishing projections and topography | Dissecting reciprocal connections and subnuclei |
| Main limitation | Limited synaptic and cell-type resolution | Greater dependence on vector design and experimental targeting |
| Interpretation | “This population projects here” | “These circuit elements are connected through a defined route” |
For researchers visualizing the zebrafish habenular circuitry, the practical principle is simple: use a route-tracing method to draw the scaffold, then use a cell-specific or trans-synaptic method to test what that scaffold contains.
2. Photoconversion and transgenic reporters in zebrafish development
The developing zebrafish brain offers a different kind of access to circuit formation. Rather than fixing the tissue at one moment and inferring a sequence from separate specimens, researchers can use transgenic fluorescent proteins to mark selected neuronal populations and follow their changing distribution.
Kaede photoconversion is especially useful for this purpose. In transgenic lines such as Tg(lhx5:Kaede), ultraviolet illumination switches the fluorescent protein from green to red in a selected population. The color change creates a temporal landmark. Cells or processes that were exposed to ultraviolet light can later be distinguished from newly labeled or unconverted tissue.
That simple shift in color changes the logic of the experiment. Instead of asking only, “Where are these cells now?” researchers can ask, “Where did this population move or extend after the conversion event?”
Reading the developmental image layer by layer
A useful photoconversion experiment has at least three visual layers:
- The original green signal, which marks the reporter-expressing population before conversion.
- The red signal, which identifies the region exposed to ultraviolet light and creates the time-stamped cohort.
- The later trajectory, which reveals how labeled cells or axons contribute to the developing habenulo-interpeduncular tract.
This makes Kaede more than a decorative fluorescent label. It is a way of assigning temporal information to anatomy.
In the context of the habenulo-interpeduncular pathway, photoconversion can help map how the tract develops toward the interpeduncular nucleus, how axonal populations are organized, and how left–right differences emerge. The zebrafish model is particularly valuable because developmental structures can be imaged at larval stages, including around the 7 days post-fertilization window used in circuit studies.
The method is also visually disciplined. A color change is meaningful only if the exposure area, timing, and imaging conditions are controlled. Luminance, background fluorescence, and optical sectioning all affect how easily green and red populations can be separated. In a crowded developmental brain, the quality of the visual readout is part of the experimental validity.
In developmental neurobiology, color is not merely a label. With photoconversion, it becomes a timestamp embedded in the anatomy.
What photoconversion can—and cannot—show
Photoconversion is strongest when the central problem is developmental origin or movement. It can indicate whether a labeled population contributes to a later tract and help reveal the sequence by which a connection becomes organized.
It does not, on its own, prove that every labeled axon forms a functional synapse. Nor does it fully resolve the molecular instructions guiding each growth cone. If the question concerns axon guidance mechanisms, photoconversion should be paired with genetic perturbation, molecular markers, or anatomical tracing.
This distinction matters in the habenulo-interpeduncular system because developmental anatomy can be more complex than the mature diagram suggests. In avian embryos, immunohistochemical mapping with markers such as BEN has revealed atypical transthalamic courses of the tract at HH30 and HH35 stages. The precise molecular cues responsible for that unusual trajectory remain incompletely identified. A visible route is evidence of a route—not yet an explanation for why the route was selected.
3. Optogenetic-assisted mapping: when anatomy becomes current
Tracing tells us where a pathway travels. Optogenetic-assisted circuit mapping asks whether activating that pathway produces a measurable postsynaptic response.
In this approach, Channelrhodopsin-2 is expressed in a defined habenular population. Light activation then stimulates those neurons or their axon terminals while researchers record from target cells in the interpeduncular nucleus using patch-clamp electrophysiology.
The experiment joins two kinds of resolution:
- Optical specificity, which selects the pathway or neuronal population to activate.
- Electrophysiological precision, which records the timing and character of the target response.
In zebrafish, this combination has revealed a fast glutamatergic current followed by a slower-rising cholinergic current. That sequence carries more information than a labeled projection alone. It suggests that the pathway can transmit through distinct temporal components, with rapid excitation followed by a slower cholinergic contribution.
The distinction between those currents is not a minor technical detail. Neural circuits are shaped by timing. A fast current can influence immediate spike probability, while a slower component may extend or modulate the response window. The measured waveform therefore becomes a functional image of synaptic architecture—an image drawn in voltage and milliseconds rather than fluorescent intensity.
How to interpret a functional map
A careful optogenetic mapping experiment separates several claims that are often compressed into one sentence:
1. The stimulated neurons express the light-sensitive actuator.
2. Light activation reaches their axons or terminals in the target region.
3. Target neurons produce a time-locked electrical response.
4. The response has pharmacological or kinetic features consistent with particular transmitter systems.
5. The connection is therefore functionally effective under the tested conditions.
The final point should remain bounded. A functional response in a slice does not reproduce the full behavioral state of an intact animal. It establishes synaptic transmission under controlled experimental conditions.
The method also depends heavily on optical geometry. Light intensity, tissue scattering, expression level, recording location, and the distance between the illuminated fibers and the patch electrode all influence the result. A well-designed figure should make these spatial relationships legible rather than burying them under color gradients and excessive annotation.
For a data visualization lead, this is where design and interpretation meet directly. The most persuasive panel is not necessarily the most saturated one. It is the panel that allows the reader to distinguish stimulation timing, baseline activity, fast current, slow current, and control condition without forcing the visual cortex to solve an avoidable puzzle.
4. Non-invasive neuroimaging: from DTI to 7T MRI
The previous methods provide cellular or circuit-level access in experimental tissue. Human neuroimaging works at a different scale. It cannot currently map the habenulo-interpeduncular pathway in vivo at single-cell resolution, but it can investigate its broader anatomical connectivity and functional activity.
DTI tractography follows directional structure
Diffusion tensor imaging estimates the direction of water diffusion in tissue. In organized white matter, diffusion tends to be constrained along axonal structures. Tractography uses those directional estimates to reconstruct probable fiber pathways.
For the habenulo-interpeduncular tract—also known as the fasciculus retroflexus—DTI can contribute to in vivo estimates of anatomical connectivity. BOLD fMRI can be used alongside it to examine blood-oxygen-level-dependent activity associated with regions in the pathway.
These methods answer related but distinct questions:
- DTI: Where might the organized fiber pathway run?
- BOLD fMRI: Which regions show coordinated changes in blood-oxygen-dependent signal?
- Combined interpretation: Do anatomical and functional patterns support a coherent pathway-level model?
The word “support” is important. Tractography produces modeled streamlines, not a direct photograph of every axon. Spatial resolution, crossing fibers, signal quality, and the small size of the habenula and interpeduncular structures all constrain interpretation. Functional coupling also does not necessarily establish a direct monosynaptic connection.
A visually confident streamline can therefore be scientifically modest. Its value comes from agreement with anatomy, physiology, and developmental evidence—not from its appearance alone.
What 7T imaging adds
Ultra-high-field ex vivo MRI provides a more detailed view of the human habenula. At 7T, studies have achieved isotropic resolutions of approximately 0.3 millimeters for T1-weighted imaging and 60 micrometers for T2*-weighted imaging, allowing researchers to distinguish medial and lateral habenular nuclei in greater detail.
This is a substantial advance over conventional in vivo imaging, but the experimental context must remain visible: ex vivo resolution is not the same as living, non-invasive resolution. The detailed image can support anatomical atlases and improve interpretation of lower-resolution human data. It should not be presented as evidence that individual cells or synapses are being resolved inside the living brain.
The developmental timeline adds another layer. In human fetuses, the habenulo-interpeduncular tract is among the earliest major fiber tracts to develop in the diencephalon and can be visible as early as 8 to 12 weeks of gestation. That early appearance places the pathway within a broader question about how foundational forebrain circuits are assembled before mature behavior emerges.
Human imaging versus zebrafish mapping
| Feature | Zebrafish circuit mapping | Human MRI-based mapping |
|---|---|---|
| Scale | Cellular, axonal, and synaptic | Regional and pathway-level |
| Main tools | Reporters, photoconversion, optogenetics, tracing | DTI, BOLD fMRI, high-field MRI |
| Developmental access | Direct imaging across larval stages | Primarily cross-sectional or ex vivo anatomical evidence |
| Left–right organization | Can be examined in fine anatomical detail | More difficult to resolve in vivo |
| Functional evidence | Direct electrical responses can be recorded | Functional activity is inferred from hemodynamic signals |
| Core limitation | Experimental manipulation may not capture the whole organism | Resolution and indirect measurement limit circuit claims |
The two systems are not competing versions of the same experiment. Zebrafish studies expose mechanisms and cellular sequence. Human imaging tests whether broader anatomical and functional patterns can be detected in our own species.
Why the four methods work best together
A robust map of the habenulo-interpeduncular pathway is built by stacking evidence rather than choosing a single “best” technique.
Chemical tracing can establish the projection and its topography. Viral tracing can identify directed partners and subnuclear organization. Photoconversion can show when a population becomes incorporated into the developing tract. Optogenetic mapping can test whether the anatomical connection carries fast glutamatergic and slower cholinergic signals. MRI can extend the anatomical question into the human brain, where direct cellular access is not available.
The workflow is therefore cumulative:
1. Locate the pathway. Use conventional anatomical tracing to define its broad course.
2. Separate populations and targets. Add genetic reporters or viral tools to resolve cell types and reciprocal relationships.
3. Track development. Use photoconversion to mark a population in time and follow its later contribution.
4. Test transmission. Activate a defined projection while recording from the interpeduncular target.
5. Translate cautiously. Compare the experimental circuit with DTI, BOLD fMRI, or high-field human anatomical data.
This sequence also protects against a common interpretive error: asking one image to answer five biological questions. The strongest studies are often the ones whose figures are modest but well matched to their claims.
A map of the habenular circuitry should make its uncertainty visible. Laterotopy may be clear in zebrafish while remaining difficult to resolve in humans. A developmental trajectory may be observed without its molecular guidance cues being known. A tract may be identified anatomically while the functions of individual interpeduncular subnuclei remain poorly understood.
That is not a failure of the map. It is the honest edge of the current resolution.
A practical visual standard for pathway figures
Because these experiments generate dense spatial data, presentation is not an afterthought. The visual design of a circuit figure determines whether distinctions survive contact with the reader.
A useful figure should preserve at least four contrasts:
- Origin versus target: use consistent colors or symbols for habenular source populations and interpeduncular destinations.
- Anatomy versus function: separate fluorescent or tracer-based evidence from electrophysiological traces and hemodynamic signals.
- Developmental time: make conversion time, embryonic stage, or days post-fertilization explicit.
- Direct evidence versus model: distinguish observed labeled fibers from inferred tractography streamlines or reconstructed connectivity.
Luminance is especially important in fluorescence images. Two labels with similar brightness can merge perceptually even when their hues differ. Conversely, a highly saturated color can dominate the panel and make weaker but biologically important structures disappear. The same principle applies to tractography: a dense bundle of streamlines may create a visual impression of certainty that exceeds the underlying measurement.
For readers building their own research figures, the most reliable order is anatomical context first, pathway identity second, quantitative detail third. Begin with the brain region and orientation. Then show which population or tract is labeled. Only after that introduce synaptic currents, resolution values, or developmental comparisons.
The figure should guide the eye in the same order that the experiment guides the inference.
The central limitation: a tract is not a behavior
The habenulo-interpeduncular pathway is often discussed in relation to motivated behavior, aversion, reinforcement, and neuromodulatory control. Yet a structural map alone cannot establish the behavioral role of every component. The interpeduncular nucleus is internally organized, and the functional contribution of its individual subnuclei in humans remains incompletely understood because current non-invasive imaging cannot resolve them with cellular precision.
Likewise, the presence of a cholinergic current in zebrafish tells us about synaptic transmission in the mapped preparation. It does not, by itself, explain how the pathway shapes a complete behavioral sequence in the intact animal.
The route matters. The laterotopy matters. The developmental timing matters. But behavior emerges from the interaction of multiple circuits, neuromodulators, internal states, and sensory conditions. The pathway map is a foundation, not a finished theory.
Final principle
The four major mapping methods answer four different versions of the same question:
- Chemical and viral tracing: who connects to whom, and along which route?
- Photoconversion: when and from where does the developing connection arise?
- Optogenetic-assisted mapping: does the connection transmit, and with what temporal signature?
- DTI, BOLD fMRI, and 7T MRI: can the pathway’s broader architecture be examined in the human brain?
The most defensible interpretation comes from their overlap. Trace the route before assigning its function. Mark developmental time before describing maturation. Record synaptic transmission before calling a projection functional. Treat human tractography as a constrained model, not a cellular photograph.
The actionable principle is clear: design each map around the biological layer it can truly resolve, then let the layers meet without pretending they are identical.