Light-sheet zebrafish imaging: from mounting to data
A light-sheet zebrafish brain protocol can fail before the microscope ever starts collecting data.
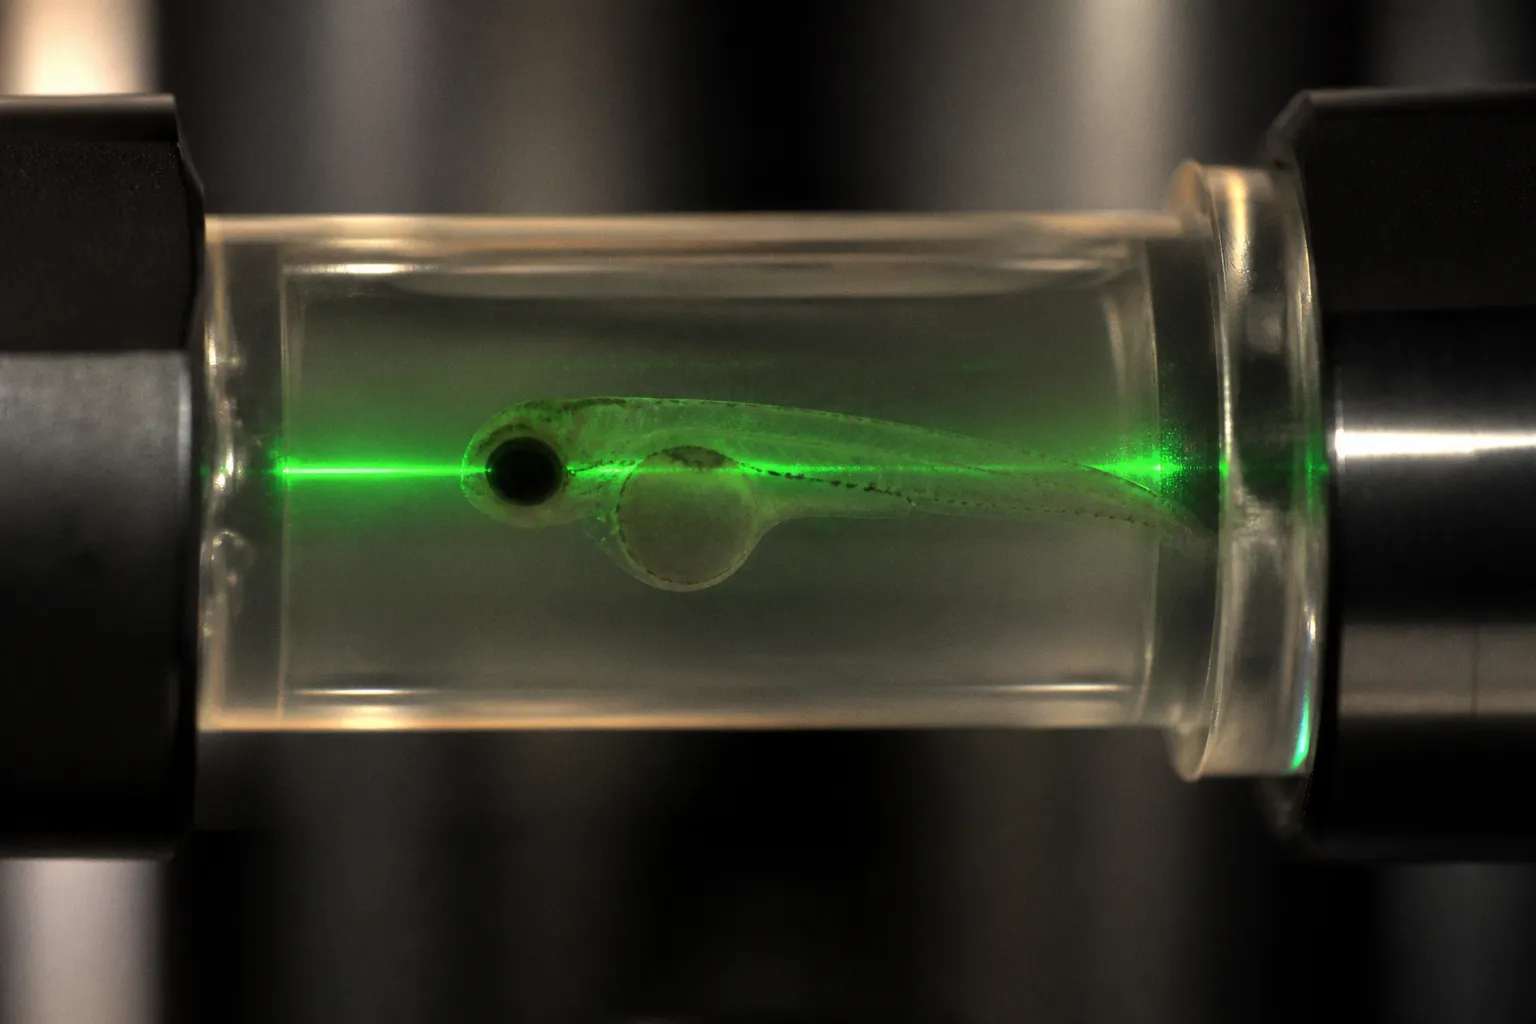
The usual culprit is not a dramatic optical problem; it is a larva immobilized too tightly, an agarose concentration chosen for convenience rather than development, or a chamber whose tricaine concentration no longer matches the mounting medium. By the time the first volume arrives, you are already imaging a stressed, drifting, or developmentally constrained preparation.
Let’s fix the problem at the bench. For long-term functional imaging in Danio rerio, the preparation has to do several jobs at once: keep the larva still, leave room for normal growth, preserve optical access, maintain stable anesthesia, and avoid turning the illumination itself into an unwanted visual stimulus. That is a demanding little checklist for an animal only a few millimeters long. The good news is that the workflow becomes much more predictable once we separate mounting, physiological control, optical design, and computation instead of treating them as one giant “microscopy day” problem.
Why standard agarose mounting becomes the wrong tool
For a short acquisition, traditional capillary embedding in approximately 1.5% low-melting-point agarose is familiar and often perfectly serviceable. It holds the larva firmly and makes loading straightforward. The trouble begins when the experiment extends into long-term or developmental imaging.
A dense agarose column restricts the larva’s ability to grow and can contribute to morphological abnormalities during multi-day experiments. The same rigidity that feels reassuring during a ten-minute acquisition becomes a biological confound when the preparation needs to remain viable and develop normally. If your experiment asks whether neural activity changes across hours or days, you do not want the mounting matrix quietly changing the animal’s development in the background. That is not a clean signal; it is a very committed artifact.
For extended imaging, a useful alternative is low-concentration agarose inside a fluorinated ethylene propylene tube, usually called an FEP tube. The mounting medium can be reduced to 0.1% low-melting-point agarose, which provides enough support for imaging while greatly reducing the mechanical restriction associated with 1.5% capillary embedding.
The FEP tube approach is especially helpful when you need:
- repeated imaging over a long time window;
- preservation of normal larval growth and morphology;
- a stable cylindrical sample geometry for rotation or translation;
- optical access from more than one direction;
- compatibility with volumetric light-sheet acquisition.
The point is not that 0.1% agarose is magically better in every experiment. It is that the matrix should match the biological timescale. A stiff mount is useful when your only priority is immediate immobilization. A gentler mount becomes more valuable when development, physiology, and repeated observation matter just as much as positional stability.
The mount is part of the experiment, not packaging around it. If it changes development or physiology, it changes the question you think you are asking.
Preparing the FEP tube
Cleanliness matters here because the tube sits directly in the optical and chemical environment of the preparation. Residual contamination, poor wetting, or trapped bubbles can create more trouble than the tube itself.
A practical preparation sequence uses the following steps:
1. Flush the FEP tube with 1 M sodium hydroxide.
2. Ultrasonicate the tube in 0.5 M sodium hydroxide for 10 minutes.
3. Flush thoroughly with double-distilled water.
4. Flush with 70% ethanol.
5. Ultrasonicate again in 70% ethanol for 10 minutes.
6. Rinse or exchange solutions according to your laboratory’s validated cleaning and sterilization workflow before introducing the embryo.
The exact handling around the final rinse depends on your facility’s biosafety and imaging practices, but the underlying logic is stable: remove residues, wet the internal surface properly, and avoid carrying cleaning solutions into the biological preparation. FEP is wonderfully useful and wonderfully unforgiving of sloppy bubbles. A small air pocket can distort the imaging path, interrupt sample contact, and make a beautiful dataset look like it was recorded through aquarium glass.
Loading the larva without turning the procedure into a wrestling match
Prepare the low-melting-point agarose before you bring the larva to the loading station. You want the medium warm enough to remain liquid but not so warm that it adds unnecessary thermal stress. Add tricaine to the mounting agarose at the concentration selected for your preparation, within the commonly used range of 133–200 mg/L.
The tube should be filled smoothly, with as few interruptions as possible. Work slowly enough to prevent bubbles, but not so slowly that the agarose begins to set before the larva is positioned. This is one of those procedures where an extra minute of prep saves twenty minutes of “why is the brain tilted and why has the animal migrated out of the field?”
Positioning depends on the imaging geometry. For dorsal brain imaging, you generally want the brain exposed to the light-sheet path with minimal obstruction from the trunk or yolk. For lateral or multi-angle acquisition, the correct orientation may be different. Decide the optical access you need before loading rather than trying to recover it after the agarose has set.
The useful test is simple: can you identify the brain, eye, and major anatomical landmarks in the intended view without forcing the sample into an extreme orientation? If not, do not rely on computational registration to rescue a poor mount. ANTs can align images; it cannot make an occluded brain visible.
Anesthesia is a control variable, not a footnote
Tricaine, or MS-222, is commonly used to immobilize larval zebrafish for imaging. In this workflow, the concentration in the mounting agarose should match the concentration in the imaging chamber. A mounting medium containing 133–200 mg/L tricaine followed by a chamber with a different concentration creates an avoidable chemical transition during the experiment.
That mismatch can affect movement, recovery, and the stability of the preparation. Even when the larva appears motionless, small changes in muscle tone or physiological state can contaminate calcium signals and complicate motion correction. The microscope does not know whether a change in fluorescence came from a neuron, a twitch, or the sample settling by a few micrometers. It simply gives you pixels and expects you to sort out the mess.
We should also be honest about what the concentration range means. There is no single tricaine concentration that is automatically optimal for every developmental stage, genotype, assay, and imaging duration. Sensitivity varies with age and experimental context. Treat the 133–200 mg/L range as a working reference, not as a universal law engraved on a pipette.
Before collecting a long movie, allow the preparation to equilibrate in the chamber. Watch for:
- residual movement in the trunk, tail, or eyes;
- gradual drift caused by incomplete setting or poor tube support;
- changes in heart activity or general morphology;
- bubbles forming near the brain or objective path;
- fluorescence changes that begin before stimulation or acquisition.
A short test acquisition is cheap compared with discovering after several hours that the preparation slowly rotated out of alignment. Record the chamber conditions, tricaine concentration, temperature, and elapsed time from mounting to imaging. Those details often explain the difference between two apparently identical experiments.
What if the larva still moves?
First, distinguish biological movement from mechanical movement. A tail flick, eye motion, or local twitch has a different signature from global sample drift. If the entire brain shifts together, inspect the tube, the agarose interface, and the chamber support. If only specific structures move, the anesthesia or mounting geometry may need attention.
Do not solve every movement problem by simply increasing tricaine. A stronger anesthetic condition may reduce behavior, alter physiology, or make comparisons across groups harder. If you are studying sensory responses or neural dynamics, immobilization is not the only endpoint; preserving a meaningful physiological state matters as well.
This is also where your experimental design should declare its priorities. A freely behaving preparation, a fictively behaving preparation, and a deeply immobilized preparation answer different questions. The cleanest image is not automatically the most informative experiment.
Optical design: when the light becomes part of the stimulus
Light-sheet fluorescence microscopy is attractive for zebrafish neurobiology because it can capture large volumes quickly while limiting illumination outside the focal plane. In larval zebrafish, that combination supports whole-brain or near-whole-brain functional imaging at cellular resolution.
But “light-sheet” does not mean “stimulus-free.” In visual behavior experiments, one-photon excitation can expose the retina to visible light and create an unintended sensory input. If the experiment measures responses to visual stimulation, that is a serious confound. The excitation beam may be asking the animal a question before your stimulus protocol has even begun.
A two-beam arrangement can reduce this problem. One beam scans the brain laterally but switches off rapidly when it enters an elliptical exclusion region positioned over the eye. A second beam approaches from the front to continue scanning the relevant neural volume. This design preserves illumination where you need it while reducing direct excitation of the retina.
The exclusion region should be treated as an optical design parameter, not as a decorative setting. Make it large enough to protect the eye from direct excitation but not so large that it removes useful brain volume. Confirm the geometry with anatomical landmarks and test the timing of beam switching. If the light does not shut off quickly and reproducibly inside the defined region, the setup may still produce visual stimulation.
There is another route: two-photon light-sheet fluorescence microscopy. Near-infrared excitation avoids the same kind of visible-light confound associated with one-photon setups and can support whole-brain volumetric acquisition at rates around 5 Hz. That speed is valuable when neural activity changes on a subsecond timescale, although the system, alignment, optical access, and signal budget become more demanding.
Choosing acquisition speed without oversampling your noise
A fast volume is only useful if the signal-to-noise ratio remains adequate and the acquisition does not create excessive photobleaching or file-handling problems. In one reported volumetric configuration, an approximately 800 × 600 × 200 µm³ brain volume can be acquired every 1.3 seconds, with 5 µm steps, 30 ms per image, and a 5 ms exposure time. That scale can cover more than 80% of the larval brain’s neurons at single-cell resolution.
Those numbers are a useful reference for thinking about the trade-off:
| Acquisition choice | What you gain | What can go wrong |
|---|---|---|
| Smaller z-step | Better sampling through depth | More planes, larger files, longer volumes |
| Shorter exposure | Faster temporal sampling and less motion blur | Lower photon counts and noisier traces |
| Larger field of view | More neurons and broader network context | Lower effective resolution or weaker signal |
| Faster volume rate | Better capture of rapid dynamics | Greater data throughput and stricter alignment demands |
| Two-photon excitation | Reduced visible-light retinal stimulation and strong optical sectioning | More complex hardware and potentially lower signal under some conditions |
Do not choose the fastest available setting simply because the microscope menu offers it. Start from the kinetics of the biological event. If your indicator response changes over seconds, a 5 Hz volume may be unnecessary. If you are studying rapid sensorimotor transitions, a 1.3-second volume may blur the sequence you care about.
A clean signal requires the acquisition rate, exposure, illumination geometry, and indicator kinetics to agree. Otherwise, you collect a very large movie of uncertainty, which is still a large movie.
The data problem arrives immediately after the pretty image
Whole-brain light-sheet imaging produces data at a scale that changes the workflow. A dataset around 380 GB is not an exotic edge case in large-scale calcium imaging; it is a practical reminder that file management belongs in the protocol from the start.
Before acquisition, decide where raw data will live, how files will be named, which metadata will travel with each recording, and which intermediate files you can safely regenerate. At minimum, record:
- larval age and genotype;
- transgenic calcium indicator and expression context;
- mounting matrix and concentration;
- tricaine concentration in both mount and chamber;
- objective, light-sheet geometry, z-step, exposure, and volume rate;
- stimulus timing and synchronization signals;
- laser power or illumination settings;
- chamber conditions and imaging duration;
- any changes made during acquisition.
Do not rely on memory. Long imaging sessions produce the kind of small deviations that feel obvious at the time and become impossible to reconstruct two weeks later.
A workable processing sequence
The computational pipeline should reduce technical variation without hiding biological variation. A typical workflow moves through several stages:
1. Inspect raw volumes and metadata.
Confirm that the acquisition completed, identify missing planes, check for sudden intensity shifts, and inspect representative volumes before launching a large analysis job.
2. Visualize the multidimensional data.
BigDataViewer in Fiji is useful for navigating large, multi-dimensional light-sheet datasets without treating every volume as a separate mystery file. Use it to inspect anatomical continuity, bleaching, drift, and obvious optical defects.
3. Correct or quantify motion.
Motion correction should respond to the actual movement pattern. Global shifts, tissue deformation, and local movement are not interchangeable problems. Save correction parameters and inspect corrected data rather than trusting a successful software run.
4. Extract calcium signals.
CaImAn is an open-source calcium imaging analysis framework designed for scalable analysis of large imaging datasets. Use it to identify components and extract activity traces, but validate the output against the raw movie. Automated extraction can split one neuron into several components, merge nearby cells, or mistake optical artifacts for activity.
5. Apply quality control.
Examine signal-to-noise ratio, baseline stability, neuropil contamination, bleaching, and the relationship between detected components and anatomical structure. A trace that looks exciting but has no convincing spatial footprint deserves suspicion, not a celebratory figure panel.
6. Register brains to a common reference.
Align anatomy and activity to a reference such as the Z-Brain atlas using tools including ANTs or elastix. Registration helps compare neural activity across animals, but it requires manual inspection and, often, parameter tuning.
A common mistake is to treat segmentation and registration as independent technical chores. They are linked. If you extract calcium components from a volume with severe drift, the component footprints may already be distorted. If you register a poorly corrected brain to the atlas, the software may produce a mathematically valid transform that is biologically unhelpful.
Automation is excellent at repeating a decision. It is not excellent at deciding whether the decision made sense in the first place.
What if CaImAn runs but the output looks wrong?
Begin with the simplest explanations. Check whether the input dimensions, channel order, and time axis match what the pipeline expects. Confirm that the data have not been accidentally rescaled, clipped, or converted in a way that changes intensity relationships. Then inspect a handful of detected components in the original movie.
If the algorithm detects broad, low-contrast regions rather than cell-shaped sources, the issue may be optical quality, preprocessing, or parameter selection rather than a failure of the software. If it finds many more components than expected, look for noise, light-sheet artifacts, or duplicated planes. If it finds too few, check whether the threshold is too conservative or whether the signal has been weakened by bleaching and poor excitation balance.
Large files also expose ordinary hardware limitations. The maximum dataset size that a given CaImAn workflow can handle depends on available memory, storage speed, chunking strategy, and implementation details. Do not assume that a pipeline that works on a small test movie will behave identically on a 380 GB recording. Benchmark on a representative subset first, then scale up.
Registration to Z-Brain: alignment is interpretation
A common reference brain gives us a shared coordinate system for asking where activity occurs across animals. That is powerful, particularly when whole-brain calcium imaging produces thousands of candidate neurons across many recordings. But registration is not a neutral file-conversion step. It determines how confidently we can compare anatomical locations and functional patterns.
ANTs and elastix are widely used tools for image registration. They can help align larval zebrafish brain scans to a common template, including the Z-Brain atlas, through transformations that account for differences in position, scale, and tissue geometry. The quality of the result depends on the input images, the selected reference, preprocessing, transformation parameters, and the anatomical features available for alignment.
Use a staged approach:
Start with anatomy, not calcium activity
Register a structural or anatomical channel first whenever possible. Calcium activity can be sparse, stimulus-dependent, and uneven across the brain. It is a poor substitute for stable anatomical landmarks. Once the anatomical transform looks credible, apply the transform to the functional data or extracted component coordinates.
Inspect landmarks across the volume
Do not validate alignment from a single maximum-intensity projection. Examine multiple planes and regions, including the optic tectum, hindbrain, midbrain boundaries, ventricles, and other structures that are visible in your preparation. A projection can conceal a mismatch in depth, especially when the brain is tilted.
Keep manual review in the loop
A successful registration command only means that the optimizer found a transformation under the conditions you supplied. It does not mean that every neuron landed in the correct biological location. Manual validation remains necessary, and template alignment may require parameter tuning for different microscope configurations or sample orientations.
Separate anatomical confidence from functional confidence
You may have excellent anatomical alignment and uncertain functional correspondence. A neuron’s calcium signal can vary with expression, indicator kinetics, stimulus history, and behavioral state even when its anatomical location is consistent. Avoid presenting atlas alignment as proof that two activity traces represent identical functional roles.
This distinction is especially important in cross-animal analyses. A broad population-level pattern may be robust while single-cell correspondence remains uncertain. Report the level of inference your registration actually supports.
Building a protocol that survives real imaging days
The best workflow is not the one with the most sophisticated software. It is the one that still works when the larva is late, the tube has a bubble, the microscope queue is shrinking, and someone has just discovered that the stimulus computer is one hour ahead of the acquisition computer. Lab work has a sense of humor, usually at our expense.
A robust light-sheet zebrafish brain imaging protocol should therefore include a short pre-acquisition gate:
- Is the sample mounted in a matrix appropriate for the duration of the experiment?
- Is the larva positioned for the intended optical geometry?
- Does the chamber contain the same tricaine concentration as the mount?
- Can you distinguish the brain and eye clearly in the live view?
- Does the illumination avoid unintended retinal stimulation?
- Does a test volume show acceptable drift and signal-to-noise ratio?
- Are stimulus timing and image acquisition synchronized?
- Is storage available for the full recording plus intermediate files?
- Have you defined how CaImAn outputs and registration transforms will be validated?
That is not bureaucracy. It is cheaper than discovering after a six-hour recording that the beam path illuminated the eye throughout the “baseline” period or that the sample slowly rotated inside the tube.
A practical decision path
If you need a brief, high-resolution snapshot, standard agarose mounting may be adequate. If you need long-term developmental imaging, move toward 0.1% low-melting-point agarose in an FEP tube. If the experiment includes visual stimulation, treat retinal exposure as a central optical problem and consider beam exclusion or two-photon light-sheet excitation. If the experiment spans many animals, design the registration and quality-control strategy before collecting the first large cohort.
The key is to make each choice answer a specific experimental need:
| Experimental priority | Preparation and imaging emphasis |
|---|---|
| Short structural acquisition | Stable mounting, clear orientation, efficient optical sectioning |
| Long-term developmental imaging | Low-concentration agarose in FEP, reduced mechanical restriction, careful chamber control |
| Visual stimulus experiments | Exclusion of direct retinal excitation or near-infrared two-photon excitation |
| Rapid whole-brain dynamics | High volumetric rate balanced against exposure, signal, and data volume |
| Cross-animal circuit mapping | Consistent orientation, anatomical reference channels, validated registration |
| Large calcium imaging cohorts | Standardized metadata, scalable CaImAn workflow, storage and QC planning |
The most valuable optimization is usually not one dramatic parameter change. It is removing a chain of small inconsistencies: a different anesthetic concentration between sessions, a new mounting orientation for every larva, a missing synchronization record, or a registration transform that nobody inspected beyond the first projection.
The clean signal is built before acquisition
Light-sheet imaging gives zebrafish researchers an unusually broad view of neural activity, from single-cell calcium dynamics to coordinated patterns across much of the larval brain. But whole-brain access does not remove the need for disciplined preparation. It increases it.
Start with the biology: how long must the larva remain viable, how much movement can the assay tolerate, and what sensory inputs must remain controlled? Then choose the mount, anesthesia, optical geometry, acquisition rate, and computational pipeline around those answers. Use FEP and low-concentration agarose when long-term development matters. Match tricaine across the preparation and chamber. Protect visual assays from unintended excitation. Treat CaImAn, BigDataViewer, ANTs, and elastix as powerful tools that still need human inspection.
If your first dataset is noisy, do not immediately blame the calcium indicator or the microscope. Look at the mount, the chamber, the eye, the timing, and the metadata. Most failed experiments leave clues in plain sight; we simply tend to search for them after the file has become enormous.
Let’s make the next run easier on ourselves: prepare the tube properly, test a small volume before committing to a long movie, and build quality control into the workflow rather than bolting it on at the end. The zebrafish will provide enough biological complexity without asking us to add preventable technical chaos.