Olfactory receptor mapping in non-sensory tissues: 5 stages
A familiar problem appears halfway through a non-olfactory olfactory receptor project: the RNA-seq file contains a promising receptor, the antibody gives a beautiful fluorescent signal, and the ligand produces a calcium response.
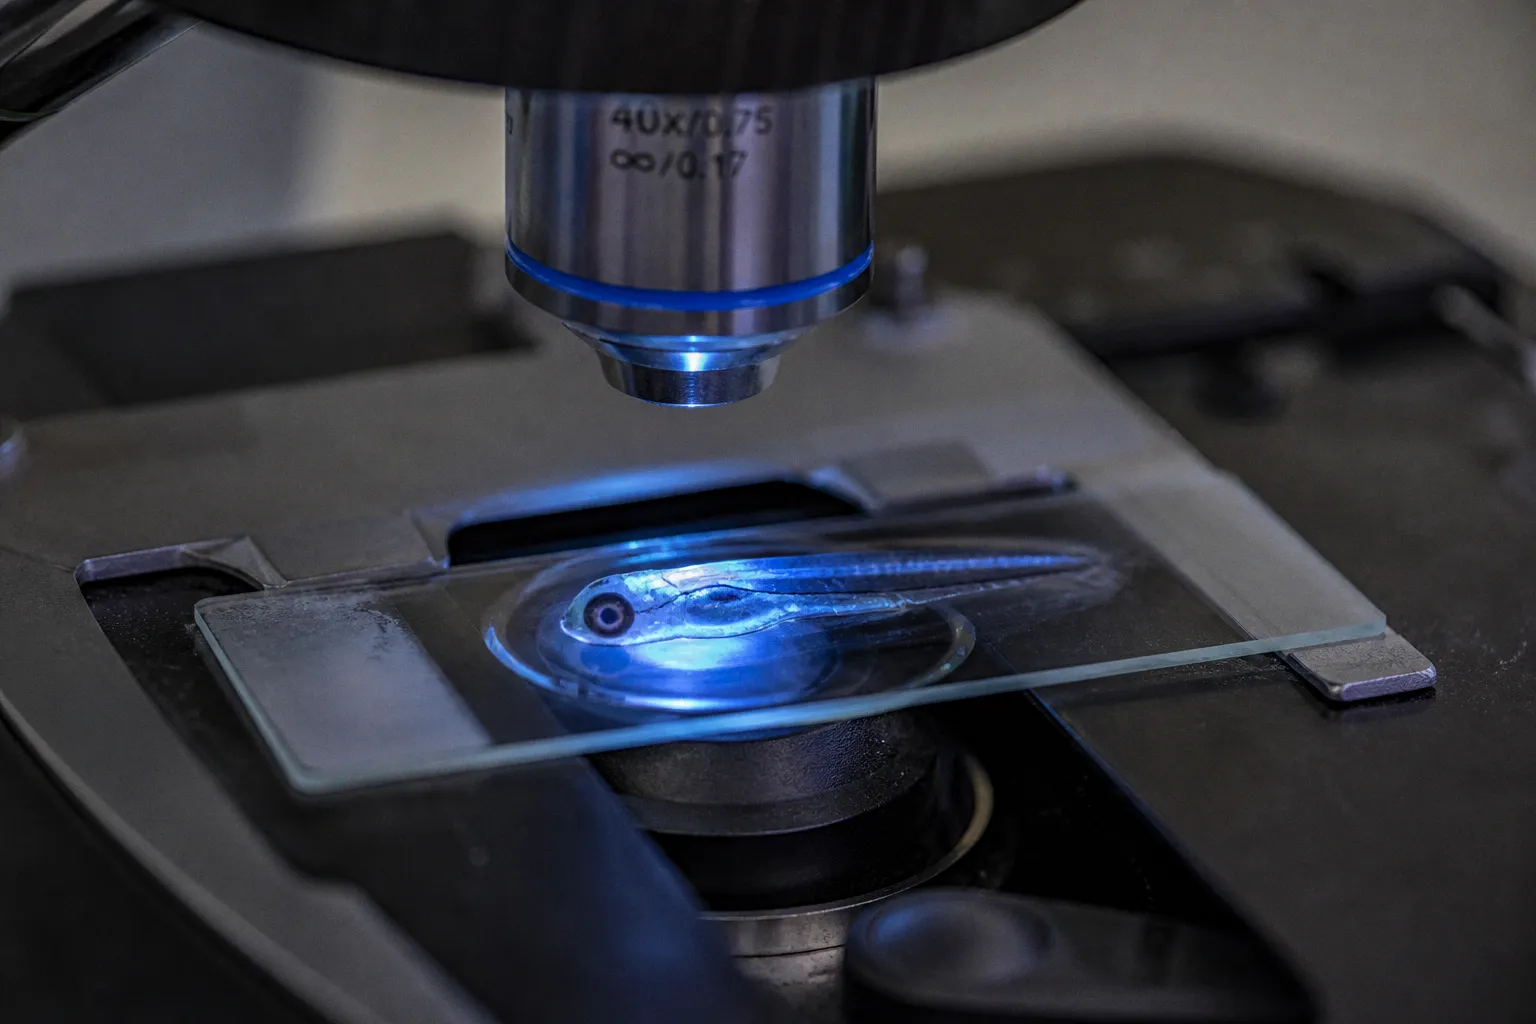
Unfortunately, the three results may be describing three different things—or, in the worst case, three different kinds of noise.
Mapping ectopic olfactory receptor expression is not a single assay with a satisfying yes-or-no readout. It is a staged argument. You first identify a candidate transcript, then locate it, then verify that the signal belongs to the receptor rather than a homolog or a leaky promoter, and only after that ask whether the receptor does anything functional in the tissue. In zebrafish, that logic is especially useful because a compact, accessible organism can make spatial experiments wonderfully tractable while also encouraging us to overinterpret a neat image.
The practical version of the non-olfactory olfactory receptor mapping protocol therefore has five stages: transcriptomic discovery, spatial mapping, molecular validation, functional testing, and physiological interpretation. Let’s walk through them in the order that keeps a clean signal separate from an attractive story.
Stage 1: Find candidate receptors with transcriptomic profiling
The first mistake is usually a simple one: starting with the receptor you already want to find.
That approach turns the experiment into a search for confirmation. Instead, begin with an unbiased survey of the tissue or cell population. Deep RNA sequencing can identify ectopic olfactory receptor transcripts in tissues that do not form part of the canonical olfactory pathway, including skin, heart, testis, muscle, cerebral cortex, and tumor tissue. A broad human RNA-seq analysis found that 111 of 400 human olfactory receptor genes reached an expression level above FPKM > 0.1 in at least one non-chemosensory tissue. That is a useful reminder that ectopic expression is not an exotic exception—but it is not proof of receptor function either.
For a zebrafish experiment, the preparation matters as much as the sequencing platform. A receptor transcript expressed in a small cell population can disappear into a whole-organ sample, while contamination from olfactory epithelium can create a spectacularly misleading hit. Before you begin the prep, define the tissue boundary operationally:
- Which anatomical region are you dissecting?
- Are olfactory epithelium, nasal tissue, taste buds, or trigeminal structures excluded?
- Are you comparing developmental stages, sexes, injury states, or behavioral conditions?
- Will the analysis use whole tissue, sorted cells, or a defined anatomical compartment?
- What tissue will serve as a canonical olfactory positive control?
The last question is not decorative. A positive control tells you whether your extraction and sequencing pipeline can detect olfactory receptor transcripts at all. A negative control from a tissue with no expected receptor expression helps expose barcode swaps, carryover, and library contamination.
Read the transcript count as a lead, not a verdict
Olfactory receptor genes are often low-abundance transcripts. That creates several competing explanations for a weak read:
1. The receptor is genuinely expressed in a small cell population.
2. The transcript is present at a very low level and may not produce enough protein to matter.
3. A related receptor or pseudogene has been misassigned during alignment.
4. The tissue contains a small amount of olfactory contamination.
5. A promoter variant or leaky transcription has produced a transcript without a functional receptor pathway.
This is why shallow sequencing and broad claims make poor bedfellows. The candidate list should be filtered, but not aggressively flattened. If you remove every low-expression receptor before looking at cell type and location, you may discard the biologically interesting signal. If you treat every low-level read as meaningful, you will spend months chasing sequencing debris. Neither is a protocol; both are forms of wishful thinking.
For zebrafish, orthology adds another layer of prep. Do not assume that a human receptor name maps neatly onto one zebrafish gene with the same ligand preference and tissue role. Receptor families can expand, diverge, or lose functional equivalence across species. Build the candidate list from sequence annotation and expression data, then describe the result as a zebrafish receptor ortholog or receptor-family candidate unless functional equivalence has actually been demonstrated.
A good first-pass dataset should give you more than a list of gene symbols. Preserve:
- normalized expression across biological replicates;
- the number of reads or unique molecular counts supporting each candidate;
- the cell or tissue compartment in which the transcript appears;
- alignment quality and multi-mapping behavior;
- expression of markers for olfactory, epithelial, neuronal, immune, vascular, and muscle populations;
- evidence of tissue contamination or unexpected cell-type enrichment.
A transcript tells you where to look next. It does not yet tell you that the receptor is translated, localized, activated, or physiologically relevant.
Stage 2: Build a spatial map at tissue and single-cell resolution
Once the transcriptomic screen gives you candidates, location becomes the central question. An ectopic receptor has to be associated with a defined cell population before you can sensibly discuss its role.
Bulk RNA-seq cannot answer that question. It tells you that the sample contained the transcript, not whether the signal came from epithelial cells, vascular cells, muscle, immune cells, neurons, or a contaminating fragment from an adjacent structure. Single-cell RNA sequencing improves cell assignment, while spatial transcriptomics restores the anatomical context that dissociation often destroys. Used together, these methods can reconstruct receptor topography across tissue sections and cell states.
Large-scale mapping efforts have reported more than 1,100 olfactory receptor gene types across millions of sensory and non-sensory cells. One spatial transcriptomic dataset included 2.3 million olfactory sensory neurons sequenced across 5 million cells. The scale is impressive, but scale does not remove the basic problem: a low-abundance receptor remains a low-abundance receptor, whether you examine it in one sample or millions of cells.
The spatial question should be narrow enough to answer
For a zebrafish project, decide whether you are trying to map:
- the receptor-positive cell type;
- the receptor’s position within a tissue layer;
- its relationship to blood vessels, nerves, muscle fibers, or epithelial boundaries;
- changes after injury, exposure, development, or regeneration;
- or a possible overlap with known sensory receptor networks.
These are different experiments. A whole-animal atlas may reveal broad distribution, but it may not give you the resolution needed to distinguish a receptor in a basal epithelial cell from one in a nearby nerve fiber. Conversely, a highly targeted section can answer a precise anatomical question while telling you very little about the rest of the organism.
Spatial transcriptomics is particularly valuable when the receptor is expressed sparsely. It can show whether the signal clusters in a reproducible anatomical niche or appears as isolated, inconsistent spots. But treat spot-level detection with caution. Depending on the platform and tissue geometry, one spot can contain RNA from several neighboring cells. That is why single-cell data, high-resolution imaging, or independent in situ validation should support the spatial assignment.
What if the transcript appears in two unrelated tissues?
Do not immediately conclude that the receptor has a universal housekeeping role. First ask whether the same transcript is genuinely present in both tissues and whether each tissue expresses the machinery needed for signaling. A receptor found in testis and muscle may have distinct local functions; a receptor found in muscle and an adjacent nerve bundle may instead reflect anatomical carryover. Tissue-specific physiology is common in ectopic OR biology, so the right response is not to force one grand explanation but to separate the tissue contexts.
This is where a small comparison table can save a great deal of experimental wandering:
| Mapping layer | What it can establish | What it cannot establish on its own |
|---|---|---|
| Bulk RNA-seq | Candidate transcript presence in a tissue sample | Which cell expresses it or whether the receptor is functional |
| Single-cell RNA-seq | Association with a cell population and co-expression state | Precise anatomical position or receptor protein localization |
| Spatial transcriptomics | Regional distribution and tissue topography | Definitive protein expression or ligand response |
| RT-PCR or qPCR | Independent transcript detection in selected samples | Correct translation, membrane localization, or physiological action |
| Immunolocalization | Protein-like signal in cells and compartments | Antibody specificity without controls |
| Ligand-induced calcium imaging | A stimulus-linked intracellular response | That the response comes directly from the receptor without perturbation controls |
The cleanest map is layered: transcriptomic evidence points to candidates, spatial evidence assigns them to cells, and orthogonal validation tests whether the signal survives outside the original platform.
Stage 3: Validate the receptor without trusting a pretty antibody
This is the stage where many projects acquire their most photogenic artifact.
Olfactory receptors belong to a large, highly homologous GPCR family. Antibodies against one receptor can cross-react with related proteins, and the availability of highly specific antibodies remains limited. In practice, a bright signal is not a strong result if the reagent has not passed the right controls.
For tissue mapping, combine at least two independent transcript-level approaches where possible. RT-PCR can confirm that a candidate transcript is present in the tissue, while targeted sequencing of the amplicon can help confirm its identity. qPCR can support comparisons between conditions, but it should not carry the entire claim when expression sits near the detection limit. Primer design must account for closely related receptor genes, possible pseudogenes, splice behavior, and genomic DNA contamination.
The controls need to be biological, not merely technical:
- no-reverse-transcriptase controls can reveal genomic DNA carryover;
- tissue-negative samples can expose nonspecific amplification;
- a canonical olfactory tissue can confirm that the assay detects receptor transcripts under the same conditions;
- independent primer pairs can test whether a result depends on one convenient amplicon;
- knockdown, knockout, or receptor-negative material can challenge an antibody signal;
- peptide-blocking controls may help, but they do not substitute for genetic specificity controls.
If your antibody produces signal in a receptor-negative sample, stop there. Do not rescue the figure with a tighter contrast setting. The microscope is not a peer reviewer, but it has an excellent memory for bad controls.
Distinguish receptor expression from leaky transcription
Promoter activity and transcript detection are not interchangeable with receptor function. Low-level transcription can arise from promoter-region variation or leaky expression, especially when a large gene family is being surveyed across many tissues. A receptor mRNA in a non-sensory tissue may be biologically meaningful, but the burden of proof rises as the signal becomes weaker and more isolated.
A practical validation chain looks like this:
1. Confirm the transcript identity. Use an independent assay and, where feasible, sequence the product.
2. Confirm the cell and location. Pair transcript detection with cell-type markers or spatial methods.
3. Confirm the protein signal. Use a validated reagent or an engineered tag in a controlled model.
4. Confirm receptor localization. A GPCR signal near the plasma membrane is more informative than diffuse cytoplasmic fluorescence, though localization alone is still not function.
5. Confirm perturbation sensitivity. Remove, reduce, or selectively block the receptor and ask whether the signal or response changes.
For zebrafish non-olfactory receptor visualization, this often means resisting the urge to rely on one whole-mount image. Whole-mount preparations are convenient, but tissue depth, antibody penetration, autofluorescence, and optical crowding can make diffuse staining look like broad expression. Sectioned material, appropriate cell markers, and matched imaging settings will usually tell you more than one dazzling composite.
What if the RNA signal is convincing but the protein signal is absent?
Several explanations remain open: the receptor may be translated below detection, the antibody may fail in that species, the transcript may be unstable or nonproductive, or the receptor may be present in a tiny subpopulation that the protein assay misses. Do not label the result a contradiction too quickly. Report it as transcript-level evidence pending protein validation, then choose a better orthogonal assay rather than quietly promoting the RNA result to a functional claim.
Stage 4: Test function with ligand-induced calcium imaging
A receptor becomes much more interesting when its activation changes intracellular signaling. For many GPCRs, calcium imaging provides a practical entry point because receptor stimulation can produce a measurable rise in intracellular Ca²⁺. But the experiment only works if the ligand, receptor, cell context, and imaging pipeline line up. That is a lot of moving parts for one fluorescent trace.
Functional testing should begin in a controlled expression system or a well-defined cell preparation, then move into the native tissue if the response is credible. This separation helps distinguish receptor pharmacology from the tissue’s broader excitability. In a native zebrafish preparation, a calcium transient may reflect activity in a neighboring cell, network coupling, voltage-gated calcium entry, or a general chemical stress response rather than direct receptor activation.
The minimum experimental logic is straightforward:
- expose receptor-positive and receptor-negative cells to the same ligand;
- include vehicle controls and concentration controls;
- record baseline fluorescence long enough to identify drift and spontaneous activity;
- use matched imaging settings across conditions;
- test whether the response is reduced when the receptor is knocked down, deleted, or pharmacologically disrupted;
- examine response timing, amplitude, reproducibility, and cellular distribution;
- include a viability or membrane-integrity check when the ligand could be toxic.
The exact ligand matters. For example, activation of OR51E2 in human vertical-growth-phase melanoma cells by beta-ionone increases intracellular Ca²⁺ and inhibits tumor-cell growth through apoptosis. That is a useful demonstration of a non-olfactory receptor pathway, but it is not a universal template for every receptor or every zebrafish tissue. It tells us that an ectopic OR can couple to a local physiological program without sending information to the olfactory bulb.
Likewise, hOR17-4 has been associated with chemotaxis in sperm, while MOR23 has been linked to muscle tissue regeneration. These examples are valuable because they show how sharply tissue context can change receptor behavior. The same broad receptor family can participate in chemotaxis, proliferation, regeneration, or apoptosis depending on the cell’s signaling machinery and local ligand environment.
Calcium imaging: clean signal or general disturbance?
A calcium trace becomes persuasive when it has the right controls and a plausible pharmacological profile. Watch for these common traps:
1. The ligand changes the medium. Altered pH, osmolarity, solvent concentration, or membrane properties can trigger calcium responses without receptor engagement.
2. The response is widespread. If every cell responds equally, you may be measuring a general stress effect rather than receptor-selective signaling.
3. The response persists after receptor removal. That points toward an off-target pathway or a non-receptor mechanism.
4. The response depends on one narrow imaging setting. That is often noise wearing a lab coat.
5. The signal appears only in overexpression. Overexpression can create artificial coupling, mislocalization, or receptor accumulation that never occurs in the native tissue.
If the receptor is a GPCR, downstream coupling may vary across cell types. A receptor that produces a calcium response in a heterologous system may not do so in muscle, epithelium, tumor cells, or zebrafish tissue. Negative calcium imaging therefore does not automatically prove that the receptor is inactive; it may mean that the chosen ligand, pathway, expression level, or readout is wrong. The solution is to narrow the claim and test the next relevant signaling layer rather than inventing a positive interpretation.
A ligand response is evidence of signaling under defined conditions. It is not, by itself, evidence that the tissue is smelling anything.
Stage 5: Separate local physiology from sensory perception
This final stage is where the wording either becomes scientifically useful or goes completely off the rails.
An ectopic olfactory receptor in skin, muscle, tumor, testis, or cerebral cortex is not automatically part of the sensory nervous system. The receptor can respond to a chemical cue through local intracellular signaling without transmitting an odor percept to the brain. There is no need to invoke the main olfactory epithelium, olfactory bulb mapping, or conscious smell unless your data directly support a connection to those structures.
That distinction matters in zebrafish, where sensory systems are tightly integrated and anatomical proximity can be misleading. A receptor found near a nerve is not necessarily a neuronal receptor. A chemical-induced calcium signal in a skin cell is not necessarily an odor response. A receptor in a developmental tissue does not become part of odorant perception simply because its ligand has an evocative name.
The physiological interpretation should therefore answer three separate questions:
Is the receptor expressed?
This requires reproducible transcript or protein evidence, with attention to tissue boundaries, cell identity, and reagent specificity.
Does the receptor signal?
This requires a ligand-linked response that depends on the receptor and survives appropriate vehicle, expression, and perturbation controls.
Does the signaling matter to the tissue?
This requires a local phenotype: altered proliferation, chemotaxis, apoptosis, regeneration, barrier behavior, migration, or another measurable physiological endpoint. The endpoint should be linked to receptor activation rather than merely occurring in the same sample.
For example, if beta-ionone activates OR51E2 and the melanoma cells show increased intracellular calcium followed by growth inhibition and apoptosis, the strongest interpretation is a local receptor-mediated signaling pathway in those cells. It is not that the tumor has acquired a tiny nose. The receptor is using a molecular family first characterized in olfactory tissue for a different cellular job.
That is the conceptual discipline behind chemosensory transduction mapping stages: follow the receptor from transcript to place to protein to signal to tissue consequence, and stop the chain wherever the evidence stops.
How to organize a five-stage project without drowning in samples
A staged workflow does not mean running five enormous experiments at once. It means using each stage to decide whether the next one is justified.
A sensible project sequence looks like this:
1. Discovery screen: profile the selected non-sensory tissue and generate a ranked receptor list.
2. Replication and filtering: repeat the strongest candidates across biological replicates and remove likely contamination or mapping artifacts.
3. Spatial assignment: determine which cell population and anatomical compartment carry the transcript.
4. Orthogonal validation: confirm the receptor with independent transcript assays and carefully controlled protein localization.
5. Functional test: expose receptor-positive material to candidate ligands and measure intracellular signaling.
6. Physiological endpoint: connect receptor activation to a local tissue outcome.
7. Perception check: explicitly test whether the pathway has any anatomical or functional relationship to canonical sensory transmission before using sensory language.
That is technically seven actions, but conceptually it remains the five-stage workflow: discovery, location, validation, function, and interpretation. The extra steps are the guardrails between them.
For zebrafish work, record the condition of the animal and tissue with unusual care. Developmental stage, sex where relevant, injury status, feeding state, exposure history, and dissection boundaries can all change expression. A receptor may appear ectopic in one physiological state and disappear in another. That does not necessarily make either result wrong; it may mean the receptor belongs to a conditional tissue program rather than a stable identity marker.
If your candidate list is long, prioritize receptors using a combination of:
- reproducibility across biological replicates;
- expression in a defined cell population;
- spatial enrichment rather than scattered isolated reads;
- a plausible receptor sequence and annotation;
- availability of a credible ligand or perturbation strategy;
- a measurable local phenotype;
- and a control path strong enough to challenge your preferred interpretation.
Do not prioritize solely by the prettiest fold change. A modest, reproducible signal in a specific cell type is often more valuable than a dramatic result spread across a contaminated bulk sample.
The interpretation traps worth catching before they reach the manuscript
The most common errors in ectopic receptor studies are not exotic technical failures. They are small leaps in language.
Detection becomes expression. A few reads are described as robust tissue expression without discussing abundance, mapping quality, or replication.
Expression becomes function. The presence of mRNA is treated as proof that a receptor is translated and active.
Function becomes perception. A ligand-induced local response is described as odor sensing, even though no sensory neural transmission has been shown.
A receptor family becomes a single mechanism. Evidence from OR51E2 in melanoma, hOR17-4 in sperm, or MOR23 in muscle is presented as though all ectopic receptors share the same pathway.
An antibody image becomes localization. Without genetic or orthogonal controls, the image may represent a homolog, nonspecific binding, or tissue autofluorescence.
A model organism becomes a direct human equivalent. A zebrafish receptor candidate is given a human receptor name and assumed to preserve the same ligand response or physiological role.
The fix is not to make the paper timid. The fix is to make each claim match its strongest evidence. Say transcript detection when you have transcript detection. Say receptor-associated calcium response when you have a controlled response. Say local chemosensory signaling when the tissue phenotype supports it. Precision is not a loss of excitement; it is how you keep the exciting part believable.
The practical endpoint: a map with boundaries
A useful ectopic olfactory receptor map should show more than colored dots over a tissue image. It should tell the reader:
- which receptor or receptor family was detected;
- in which tissue and cell type;
- at what evidence level;
- with which independent validation;
- under what ligand or perturbation condition;
- through which intracellular readout;
- and with what local physiological consequence.
It should also show what the receptor is not doing, at least according to the current data. If the receptor does not connect to olfactory sensory neurons or the main olfactory bulb, say so. Negative boundaries prevent readers from importing the wrong biology into an otherwise solid result.
The field is moving toward increasingly detailed maps, combining deep sequencing, single-cell analysis, spatial transcriptomics, RT-PCR, immunolocalization, and functional Ca²⁺ imaging. That toolbox can reveal a surprisingly broad distribution of olfactory receptor genes outside classical sensory tissues. But the richer the map becomes, the more carefully we need to distinguish presence from purpose.
So, let’s keep the workflow pleasantly stubborn. Start with the tissue boundary. Demand a second assay. Challenge the antibody. Make the ligand response earn its place. Then connect the signal to something the tissue actually does. If the receptor survives all five stages, you have more than an ectopic transcript—you have a defensible piece of sensory biology operating outside the nose.