Zebrafish chemosensory assays: a dual-stimulus setup
A larval zebrafish can discriminate between two chemical cues delivered 100 µm apart—across paired nasal cavities separated by a sliver of tissue thinner than a human hair.
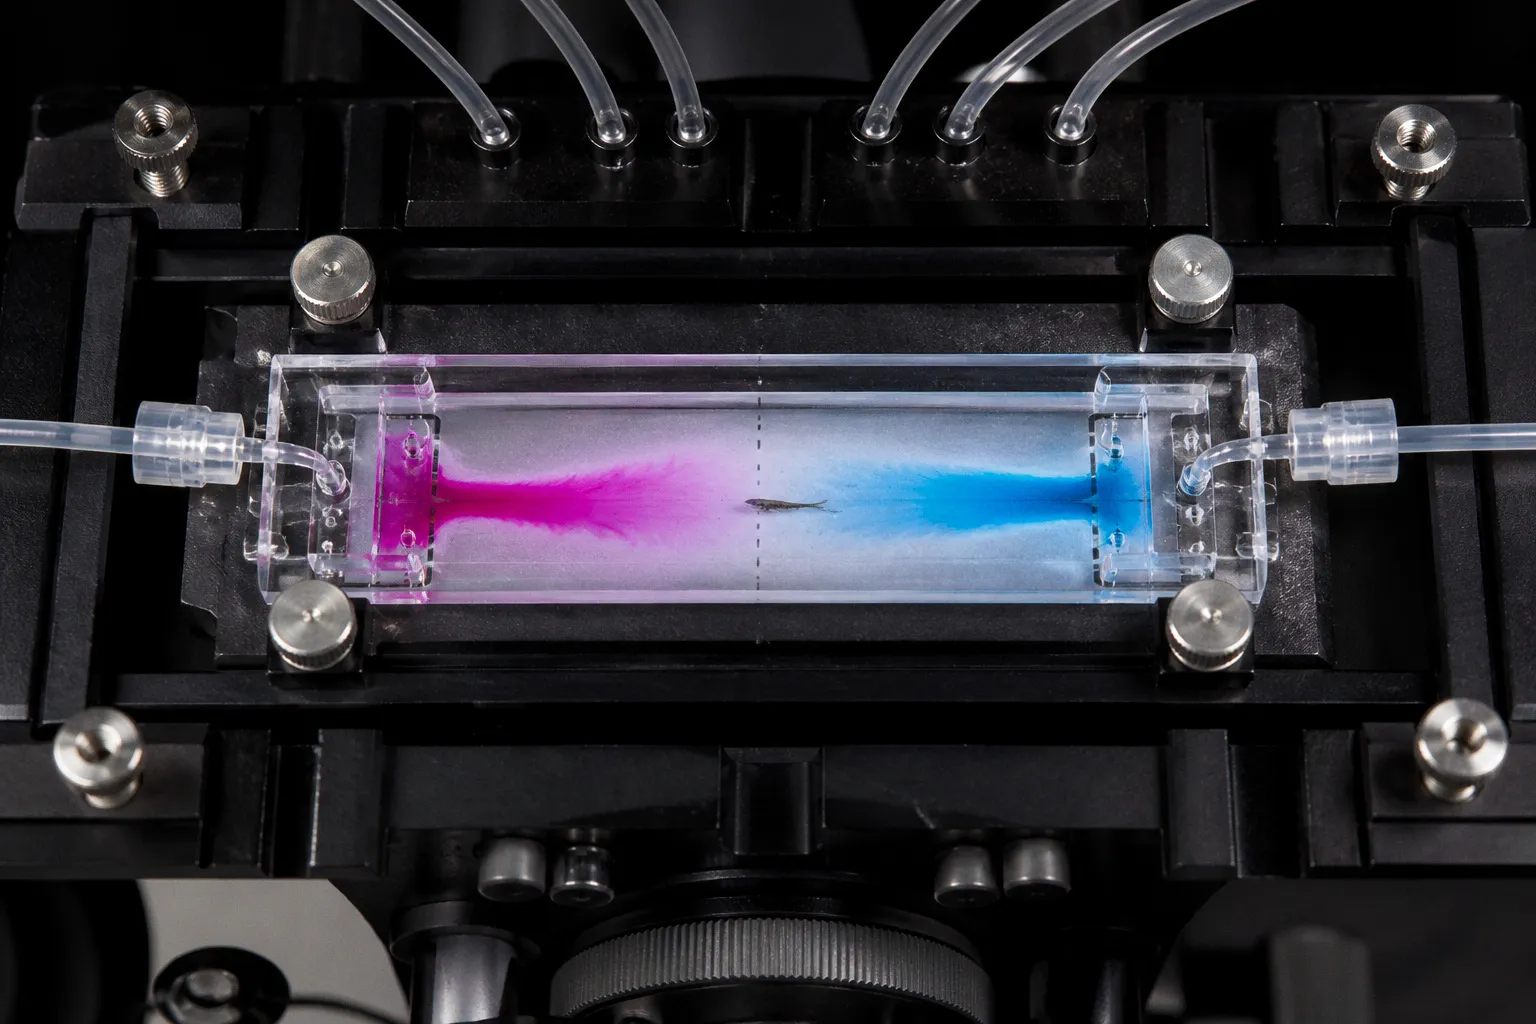
Yet many conventional assays still introduce stimuli into stagnant water, blur bilateral input, and produce noise-ridden datasets that become difficult to reproduce. The gap between what the biology can resolve and what the rig can deliver is where much of the signal is lost.
Closing that gap requires more than adding an odorant to a dish. It requires a controlled flow environment that keeps the stimulus boundary stable, plus a tracking system capable of linking chemical exposure to specific motor decisions. In a useful zebrafish chemosensory assay protocol, the physical delivery system and the behavioral readout have to be designed as one experiment.
The setup described here combines bilateral microfluidic delivery, high-speed behavioral tracking, and event-based analysis of saccades and tail flips. The result is not simply a preference assay. It is a way to separate stimulus location, odor valence, and the motor programs recruited by each.
Engineering the Fish-on-Chips Arena for Precise Stimulus Delivery
The core hardware is a microfluidic swimming arena measuring 60 mm × 30 mm × 1.5 mm. These dimensions are not arbitrary. The 1.5 mm channel depth constrains larvae to a quasi-two-dimensional plane, simplifying trajectory extraction without fully restricting natural swimming. The 60 × 30 mm footprint provides enough room for free-swimming behavior while keeping the animal inside a predictable laminar-flow envelope.
Fabrication follows standard soft lithography using polydimethylsiloxane (PDMS). In practice, the most consequential part of the design is not the material itself but the inlet geometry. The two inlets must converge through a Y-junction that generates parallel streams with a stable interface. The aim is to deliver an odorant to one side of the arena and a control solution to the other without creating a broad mixing zone between them.
A poorly formed junction produces eddies and recirculation pockets. These can carry odorant across the nominal boundary, create local velocity gradients, and make the stimulus field depend on the larva’s position rather than on the experimental design. The resulting behavior may still look structured, but the animal is no longer responding to a clearly defined bilateral cue.
The inlet geometry should therefore be evaluated as part of every new device batch. Small differences in channel height, bonding quality, or tubing placement can alter the flow field even when the nominal pump settings remain unchanged.
Operational parameters to calibrate before any behavioral run include:
1. Inlet flow rate: Each stream runs at approximately 3 mm/s. This velocity is an assay-specific optimization for larval zebrafish of roughly 4 mm body length at 5–7 dpf. It is fast enough to preserve the separation between streams and slow enough to avoid introducing strong flow-driven locomotor artifacts. It should not be described as a direct representation of the full range of natural riverbed flow; its value here is experimental stability and behavioral tractability.
2. Stream uniformity: Introduce a visible dye, such as food coloring or fluorescein, into one inlet and image the arena under brightfield or fluorescence. The boundary should remain straight and stable for at least 10 minutes. Wavering, widening, or penetration across the midline indicates a mismatch in inlet resistance or pump delivery.
3. Dead-volume purge: Before loading larvae, flush the entire system at twice the working flow rate for 5 minutes. Residual air bubbles, particles, or incompletely exchanged solution near the Y-junction can distort stream geometry in ways that are difficult to identify from behavioral data alone.
4. Tubing symmetry: Keep the two inlet paths as similar as possible in length and internal diameter. Differences in tubing resistance can create a flow imbalance even when both pumps are programmed identically.
5. Boundary position: Record the position of the interface relative to the camera field. If it shifts between trials, the same x-y coordinate will not represent the same chemical environment from one animal to the next.
The optofluidic variant—the Fish-on-Chips platform published in early 2023—adds integration with light-sheet fluorescence microscopy. This makes it possible to record brain-wide calcium activity while delivering odorants to individual nasal cavities. The bilateral separation of stimulus delivery is the central advantage. Instead of applying an odorant to the entire bath and asking the brain to resolve an undifferentiated signal, the experiment can probe left-right asymmetry in olfactory-bulb activation under controlled conditions.
That distinction matters for neural network formation and sensory integration. A larva is not only detecting whether a chemical is present. It is comparing spatially separated inputs and coordinating the comparison with posture, heading, and movement. The chemosensory transduction setup becomes part of the circuit experiment.
The bilateral 100 µm separation of larval nasal cavities is not a design limitation—it is the experiment. Controlled unilateral delivery makes functional lateralization testable rather than theoretical.
The physical design also determines what can be inferred later. If the odor boundary is broad, unstable, or displaced by the animal’s own movement, a preference score cannot distinguish attraction from repeated crossing of a poorly defined interface. A clean behavioral result begins with a clean stimulus field.
Optimizing Laminar Flow for a Controlled Environmental Context
Zebrafish are riverine animals, and flow is not a neutral background variable. Wild populations encounter changing hydrodynamic conditions across sandy and rocky substrates, with reported flow velocities spanning approximately 2–12 cm/s. A stagnant-water assay removes the animal from that context entirely. The consequences can include altered swim-bout structure, exaggerated thigmotaxis, and reduced exploratory range.
The dual-stream assay addresses the problem by generating two parallel low-flow channels at approximately 3 mm/s. This velocity is optimized for the assay rather than presented as the low end of the natural riverbed range. Its purpose is to maintain a stable chemical boundary while preserving a behavioral regime in which larvae can explore the arena and express directed responses. The distinction is important: an engineered flow condition can be experimentally useful without being an ecological replica.
At this setting, the flow should support three features:
- A sharp chemical boundary between odor and control zones.
- Directional sensory input that allows mechanosensory and chemosensory information to be processed together.
- Reduced chaotic turning and drift compared with a completely stagnant preparation.
The flow field should be treated as a measured variable, not an invisible constant. Matching the volumetric flow rates of both inlets is critical. Even a small mismatch can cause the boundary to drift laterally over time, changing the effective size and position of the odor zone. This becomes a confound when the behavioral analysis assumes that the zones are fixed.
Run both pumps from the same controller when possible. If separate pumps are required, verify synchronization with dye tests at several points across the experimental window. A boundary that looks stable immediately after setup may move after the tubing equilibrates, the reservoirs begin to empty, or an air pocket shifts within the line.
Temperature requires the same level of attention. Zebrafish larvae are sensitive to thermal gradients, and a solution arriving from a chilled reservoir can produce a local temperature change that affects locomotion independently of the chemical stimulus. The arena should sit on a stage with active temperature control at 28.5 ± 0.5 °C. Allow the system to reach equilibrium with both streams running before introducing animals.
A useful calibration record includes more than the nominal pump setting. For each run or device, document:
- The measured position and width of the dye boundary.
- The time required for complete solution exchange after switching an inlet.
- The temperature at the inlet and within the observation chamber.
- The presence of bubbles or visible recirculation near the junction.
- Whether the boundary remains stable during the full behavioral recording period.
These observations make later failures diagnosable. Without them, a change in preference may be attributed to receptor signaling or neural state when the actual cause is a small change in hydraulic resistance.
High-Speed Behavioral Tracking and Thigmotaxis Stabilization Protocols
Behavioral recording runs at 240 frames per second under infrared illumination. The infrared setup is not a cosmetic improvement. Visible light activates the visual system, and phototactic bias can contaminate a measurement intended to describe olfactory or gustatory value. Infrared LEDs at 850 nm are invisible to larvae while producing sufficient contrast for automated head and body tracking.
The tracking pipeline extracts three primary variables per frame:
- Head coordinates (x, y): Position within the arena, mapped to odor and control zones.
- Heading angle: Orientation of the longitudinal body axis, used to calculate turning rate, directional persistence, and crossings of the stimulus boundary.
- Tail curvature: A measure used to detect rapid motor events and classify swim bouts.
The same coordinate system should be used for every trial. A camera that is moved between sessions, or a field of view that is cropped differently for different animals, can introduce apparent changes in occupancy that have nothing to do with chemosensory preference. The chemical boundary should be registered to the image before behavioral scoring begins.
Before odor exposure, larvae require a 10-minute acclimatization period. This is not padding around the experiment. Larval zebrafish exhibit strong thigmotaxis, an instinctive wall-hugging behavior associated with stress and exploratory state. During the first minutes in a new arena, trajectories are dominated by enclosure response, handling, and reorientation. The thigmotactic response stabilizes after approximately 560 seconds in the flow arena. Testing before this period has closed produces data in which novelty response can overwhelm chemosensory discrimination.
| Parameter | Value | Rationale |
|---|---|---|
| Frame rate | 240 fps | Resolves rapid saccade and tail dynamics |
| Illumination | 850 nm IR | Reduces phototactic confounds |
| Acclimatization | 560 seconds | Allows thigmotaxis to stabilize |
| Odor exposure window | 2 minutes | Provides a defined interval for occupancy and event analysis |
| Arena temperature | 28.5 ± 0.5 °C | Maintains standard rearing conditions |
Post-acclimatization, introduce the odorant into one inlet. The standard aversive stimulus is cadaverine at 1 mM, a biogenic amine that triggers robust avoidance in larval zebrafish through defined olfactory receptor neuron populations. Attractive stimuli, such as amino acid mixtures, can be delivered using the opposite configuration. Record for 2 minutes per trial, while preserving the same flow, illumination, temperature, and camera settings across conditions.
The position of the odor zone must be defined from the measured flow boundary rather than assumed from the nominal channel geometry. If the interface is represented by a normalized y-position, the analysis can calculate the proportion of time spent on each side. A preference index may be used as a descriptive summary, with 1.0 representing complete occupancy of the odor side and 0.0 representing complete avoidance. Values near 0.5 indicate that the animal did not show a measurable side preference during the observation window, but they do not by themselves distinguish equal exploration from inactivity, drift, or rapid repeated crossings.
For that reason, occupancy should be paired with movement metrics:
- Number of odor-zone entries and exits.
- Mean dwell time per visit.
- Crossing frequency at the chemical boundary.
- Distance travelled in each zone.
- Heading relative to flow direction.
- Bout frequency and turning amplitude.
- Fraction of the trial spent near the walls.
This combination is more informative than a single preference value. An animal that spends half of its time in each zone may be actively sampling both streams, remaining stationary near the boundary, or being carried passively by the flow. Those are different behavioral states and should not be collapsed into one interpretation.
Quantifying Odor Valence Through Coupled Saccade-Tail Flip Events
Raw occupancy time tells you where the animal went. Coupled saccade-tail flip events—S-T events—tell you how it decided to get there.
A saccade is a rapid, large-amplitude eye movement. A tail flip is a high-energy escape or reorientation motor command. When the two events occur within 0.5 seconds of one another, defined as onset-to-onset, they constitute a coupled S-T event. The temporal relationship is the important feature. The analysis is not simply counting eye movements and tail movements; it is asking whether they are coordinated within a common sensorimotor episode.
This coupling can reflect the integration of sensory evaluation with motor reorientation. In an aversive context, a larva may rapidly redirect its body and leave the stimulus zone. In an attractive context, the animal may maintain a sustained approach trajectory with fewer abrupt reorientation events. The behavioral signature is therefore richer than a final location or total occupancy time.
To extract S-T events from tracking data:
1. Detect saccades. Threshold eye-angle velocity using a value calibrated to camera resolution, magnification, and segmentation quality. A threshold above 300°/s is typical for 240 fps recordings in these arenas, but it should be validated against manually reviewed events rather than treated as a universal cutoff.
2. Detect tail flips. Identify high-amplitude tail-curvature transients exceeding the animal’s baseline by at least 2 standard deviations. Establish the baseline from the same recording whenever possible because larvae differ in spontaneous activity.
3. Couple detections. For each saccade, test whether a tail-flip onset occurs within a ±0.5-second window. If so, register one S-T event and retain the event timing and location.
4. Stratify by context. Compare event rates in the odor zone, control zone, and boundary region. Also retain the stimulus condition and the direction of movement relative to the chemical interface.
5. Compute the rate. Express S-T events per minute, while reporting the amount of time the animal actually spent moving and the number of valid tracking frames.
S-T event rate is not just a behavioral readout—it is a proxy for how the nervous system encodes chemosensory valence into coordinated motor output.
The event definition should remain stable across experimental groups, but the quality-control process should be explicit. Missed eye detections, partial tail occlusion, and brief tracking loss can all create artificial changes in event frequency. Automated detections should be reviewed on a representative subset of trials, including both high-activity and low-activity animals.
S-T analysis adds resolution beyond a preference index. Two larvae may spend similar amounts of time in the odor zone while displaying very different event profiles. One may repeatedly enter, trigger a rapid turn, and return to the boundary. Another may remain nearly motionless in the same region. Their occupancy values are similar, but the underlying sensorimotor computations are not.
The same logic applies to attractive cues. A larva that approaches an amino acid mixture in long, persistent bouts is behaviorally different from one that reaches the same zone through frequent sharp turns. The former suggests directed persistence; the latter may indicate uncertainty, competing cues, or instability in the stimulus field.
For multisensory integration in zebrafish, the location of each event is particularly valuable. An S-T event occurring immediately after entry into the odor stream suggests a different process from an event occurring near the wall several seconds later. Combining event timing with flow direction, zone occupancy, and heading makes it possible to ask whether the stimulus changes the probability of a motor transition, not merely the final distribution of the animal.
Neural Circuit Dissection: TH+ Interneurons and Sensory Integration
Behavioral phenotyping is the output layer. The mechanistic question is which neural populations translate chemosensory input into valence-tagged motor commands. Targeted ablation experiments have identified a specific population: tyrosine hydroxylase-positive, or TH+, interneurons in the olfactory bulb.
The experimental logic is straightforward. Use genetic tools to selectively ablate TH+ neurons, then repeat the dual-stimulus assay under the same flow and imaging conditions. The comparison should include both attractive and aversive stimuli, because a change in general locomotion cannot be interpreted as a selective change in valence processing.
The reported dissociation is functionally informative:
- Attraction is abolished. Larvae with TH+ ablation lose their preference for attractive odorants and no longer spend disproportionate time in the amino-acid zone.
- Aversion is preserved. The same larvae continue to avoid cadaverine, with aversive responses remaining comparatively intact.
This pattern suggests that TH+ interneurons are required for encoding or transmitting positive valence signals, while negative valence is supported by a parallel pathway. The olfactory bulb therefore does not appear to use a single undifferentiated valence channel that simply changes sign. Instead, at least part of the positive and negative response architecture is segregated early in the sensory relay.
The interpretation depends on the behavioral controls. If TH+ ablation reduces swimming, alters thigmotaxis, or changes sensitivity to flow, a loss of attraction cannot automatically be assigned to positive-valence coding. S-T event rates, total distance, boundary crossings, and control-versus-control trials help separate a specific chemosensory deficit from a broad motor phenotype.
The sensory receptor signaling assay should also distinguish input failure from valuation failure. Olfactory sensory neurons may still respond to the chemical cue even when downstream attraction is absent. Conversely, if the sensory neurons themselves are compromised, both attraction and aversion may disappear. The position of the defect in the pathway matters:
| Circuit element | Role in chemosensory behavior | Expected consequence of disruption |
|---|---|---|
| Olfactory sensory neurons | Initial transduction of chemical cues | Broad loss of chemosensory responses |
| TH+ interneurons in the olfactory bulb | Positive-valence encoding or transmission | Impaired attraction with relative preservation of aversion |
| Aversive-valence pathway | Negative-valence encoding | Potentially selective impairment of avoidance |
| Pallial integration circuits | Coordination of valence with motor programs | Changes in stimulus-guided action and behavioral persistence |
The open question is how downstream targets in the pallium integrate these streams. Recent work, including a reviewed preprint from January 2026, suggests that the pallium may encode valence-specific coordination signals linking chemosensory input to cohesive motor programs. The molecular mechanism of that translation is not yet mapped.
That uncertainty is not a weakness of the assay. It defines what the assay can do next. A stable dual-stream platform allows neural perturbations to be compared against the same physical stimulus, while event-based behavior shows whether the perturbation affects valuation, action selection, or the ability to execute a response.
Closing Protocol: Build, Calibrate, Validate
Before running an experimental cohort, complete the validation sequence under the same conditions intended for the main assay.
1. Check stream geometry. Dye-test both inlets and confirm that the boundary remains straight and stable for at least 10 minutes at the working flow rate.
2. Confirm thermal equilibrium. Verify that the arena reaches 28.5 ± 0.5 °C after the system has been flowing. Check both inlet solutions, not only the stage temperature.
3. Test imaging uniformity. Record an empty arena under infrared illumination and inspect for shadows, glare, or hot spots that could bias segmentation and tracking.
4. Establish acclimatization behavior. Run control-solution trials and examine wall occupancy, movement rate, and bout structure across the 560-second acclimatization period. The aim is to demonstrate stabilization in the actual rig, not to assume that every batch of larvae will settle identically.
5. Run a positive-control condition. Use cadaverine versus control to confirm that the system can resolve an aversive response. Interpret the resulting preference and event distributions together with locomotor measures; do not rely on an arbitrary universal preference-index cutoff.
6. Repeat the dye test after the control run. A boundary that was stable at the start can change after prolonged flow, tubing movement, or bubble displacement. The post-run image provides a check that the behavioral trial occurred under the intended stimulus geometry.
7. Review tracking quality. Exclude or flag trials with substantial frame loss, overlapping larvae, bubbles in the imaging region, or uncertain zone registration. A short recording with reliable coordinates is more useful than a longer recording built on unstable segmentation.
The positive control should establish assay responsiveness, not serve as a pass-or-fail number imported from another rig. Preference values depend on stream width, odor concentration, exposure history, larval age, handling, and the exact definition of the odor zone. A meaningful control is therefore one that is internally consistent, accompanied by stable flow and temperature measurements, and supported by the expected direction of behavioral change.
The same principle applies to attractive stimuli and neural perturbations. If attraction weakens, inspect whether the animals still swim, sample both streams, and respond to the flow field. If aversion changes, determine whether the effect appears in occupancy, boundary crossings, S-T events, or all of them. The pattern is often more informative than a single summary statistic.
A dual-stimulus arena cannot rescue an unstable experiment, but it can make instability visible. Once the flow boundary, thermal environment, illumination, acclimatization period, and tracking definitions are controlled, larval zebrafish taste and smell can be studied at the level where sensory detection becomes a decision.
The assay is only as good as the stimulus field it produces—and only as revealing as the behavioral variables used to read it.