Real-Time 3D Imaging of Seizure Activity in Zebrafish Larvae
You know that sinking feeling when you're trying to catch a seizure wave sweeping through a larval brain and your volumetric stack comes out looking like a foggy mess — well, a team at the University…
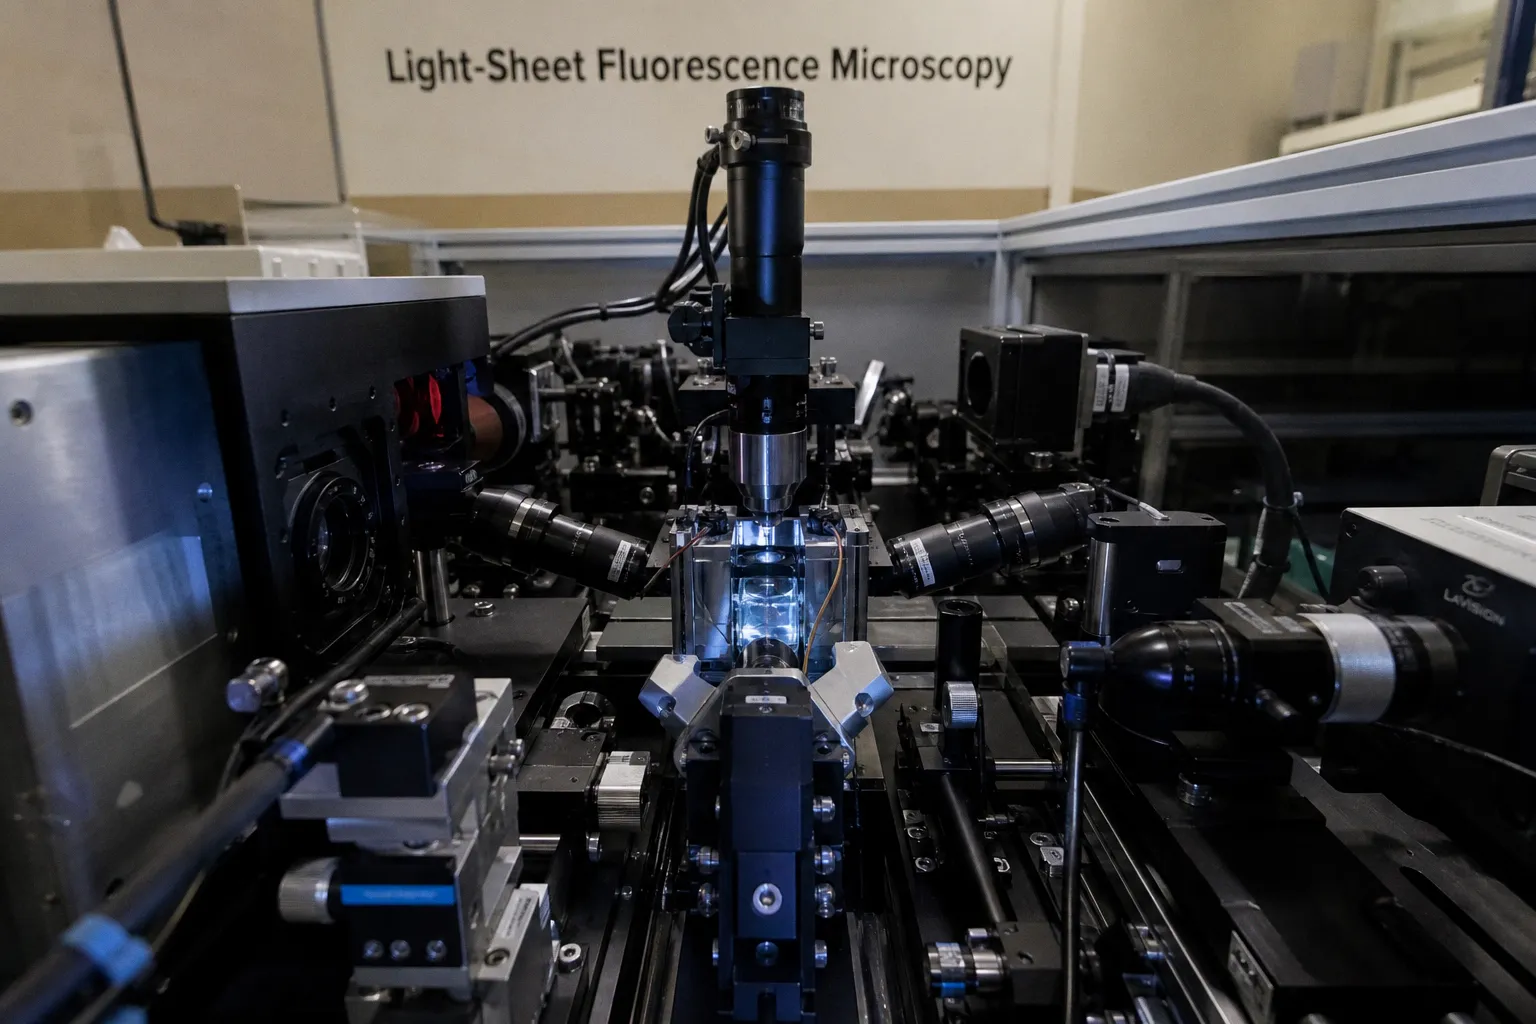
You know that sinking feeling when you're trying to catch a seizure wave sweeping through a larval brain and your volumetric stack comes out looking like a foggy mess — well, a team at the University of Georgia just published a fix we should all be looking at. Their new light-sheet fluorescence microscopy setup, paired with adaptive optics, tracks 3D electrical seizure activity in zebrafish larvae in real time at subcellular resolution. Let's break down what they actually did, because this is the kind of upgrade that quietly rewrites what your rig can answer.
How they beat the aberration trap
The system rides on light-sheet fluorescence microscopy — a thin laser sheet illuminates one plane at a time, capturing emitted fluorescence to build fast, low-damage images of living larvae. The Georgia group added an electrically tunable lens to sweep the focal plane through the sample, but that combination introduces significant optical aberrations when imaging large volumes. Sound familiar? That's exactly the failure mode most of us hit when we try to scale up to whole-brain views.
Their fix is elegant: synchronize the adaptive optics settings with the continuous scan of the light sheet. Dynamic correction happens as the sheet moves, dodging the usual speed penalty. Result: four full volumes per second — about seven times faster than their earlier demonstration.
What the clean signal actually shows
Here's the part that should make you reach for your notebook. With fluorescent bead tests, applying adaptive optics in fast-acquisition mode expanded the imaging area achieving subcellular resolution by a factor of five. In larval zebrafish, neurons appear more distinct and more spherical — basically the morphology you'd expect, instead of the stretched, smeared versions we've all been squinting at.
When they pointed the system at actual seizure events, they captured something clean: electrical activity originates toward the back of the brain, then progresses toward the midbrain region that processes visual information. Peak hits around fifteen seconds, then the wave gradually subsides as it moves toward the front of the brain. That's a propagation map you can actually plan experiments around.
What to do on Monday
If your seizure-imaging prep is bottlenecked by either speed or resolution at depth, this is worth modeling. The synchronization scheme lives in Biomedical Optics Express (doi: 10.1364/BOE.596096) and is the kind of thing you can ask your optics vendor about or sketch into a grant aim. Don't tear down your rig — but do benchmark your current tunable lens against their aberration profile, because that comparison will tell you exactly where your noise floor is hiding.
The team's next move is to use this capability to probe what causes or inhibits seizure events, which means cleaner pharmacology assays are coming down the pipeline. For now, let's use four volumes per second as our new floor for whole-brain zebrafish imaging — and start asking the experiments we couldn't before.