Zebrafish trigeminal assay: a step-by-step setup plan
A larval zebrafish trigeminal assay fails for predictable reasons. The stimulus is poorly calibrated. The larva moves inside the agarose. The probe contacts the skin at an inconsistent distance.
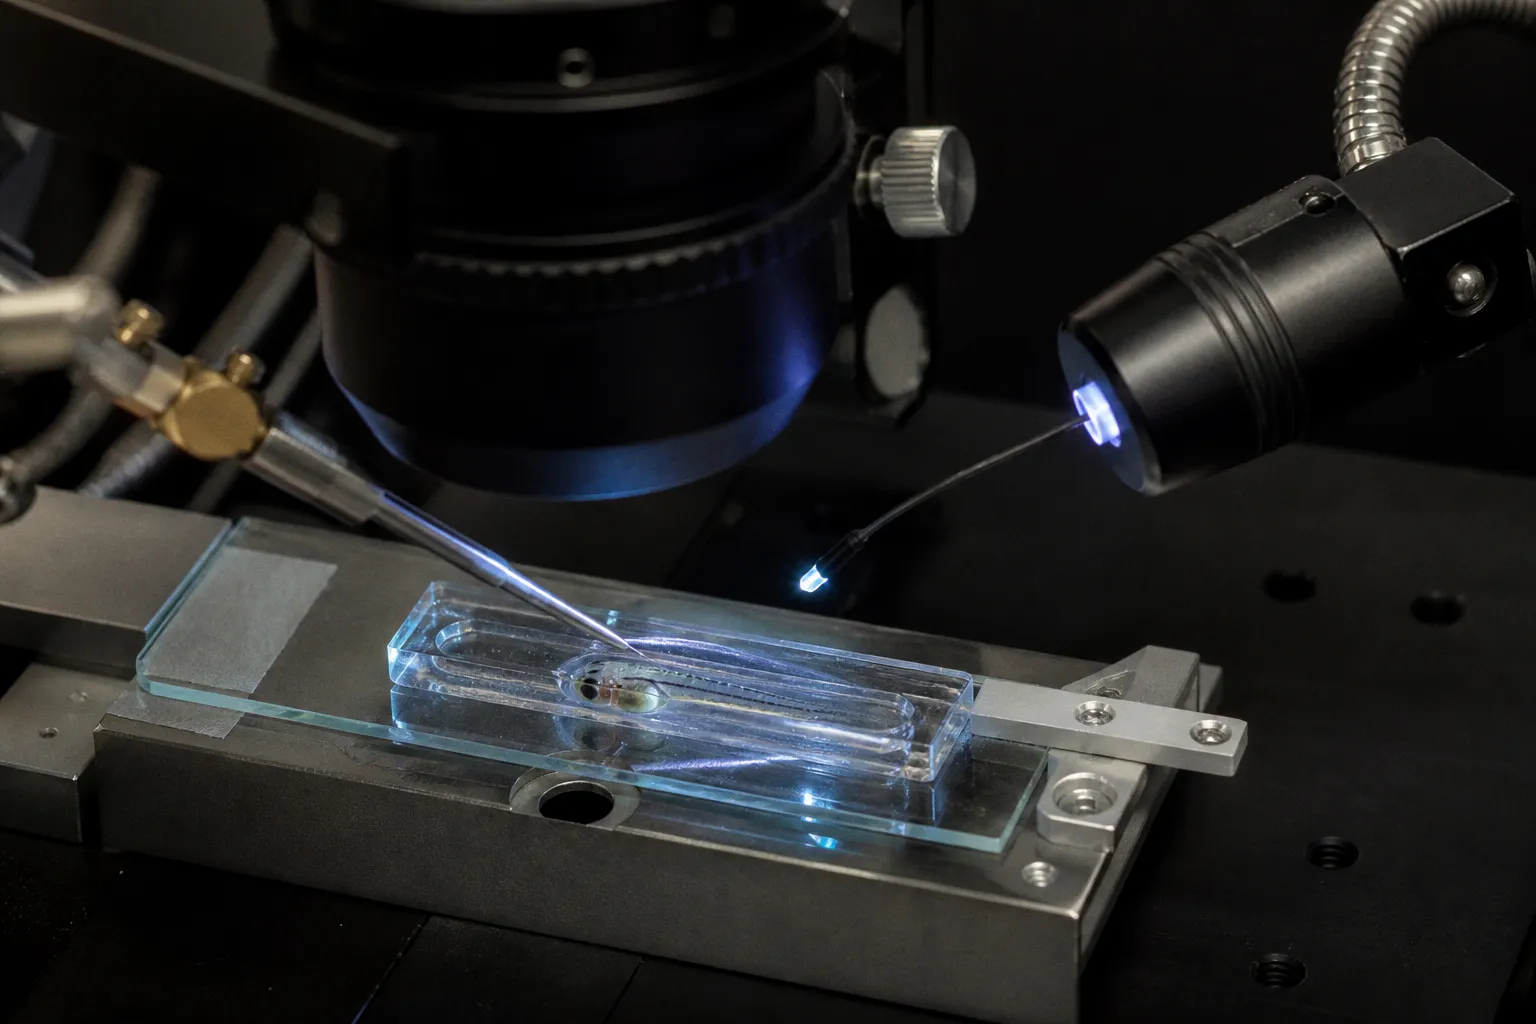
Or the recorded calcium transient is treated as a sensory response before motion, bleaching, and delivery artifacts have been isolated.
The system itself is compact. The larval trigeminal ganglion contains approximately 60 touch and somatosensory neurons, positioned posterior to the eye and lateral to the anterior hindbrain. That small circuit is sufficient to test tactile, chemical, and thermal processing, but only if the preparation keeps three variables under control: developmental stage, mechanical stability, and stimulus geometry.
This is the working logic behind a reliable zebrafish trigeminal stimulation assay protocol. First map the ganglion and define the larval stage. Then immobilize without compromising access to the head. After that, deliver one stimulus class at a time and quantify activity against a recorded baseline.
1. Fix the developmental window before designing the assay
The trigeminal ganglion appears early in zebrafish embryogenesis. Anatomically, it can be identified around the 20–25 somite stage, corresponding to approximately 19.0–22.0 hours post-fertilization. That timing matters because the assay is not measuring a fixed adult-like sensory unit. It is measuring a developing population whose connectivity, receptor expression, and stimulus responses change over time.
A protocol that pools larvae across a wide developmental range may produce a clean-looking average and a biologically ambiguous result. The first control is therefore not a reagent or imaging setting. It is stage control.
Record at least:
- Fertilization timing and developmental stage for each experimental batch.
- Whether the ganglion is being examined during early formation or after additional neuronal differentiation.
- The anatomical position of the ganglion relative to the eye and anterior hindbrain.
- The stimulus modality used in each trial.
- The response metric selected before data collection.
The ganglion’s position gives you the first map. In the larva, it sits posterior to the eye and lateral to the anterior hindbrain. This provides a practical imaging landmark and helps separate trigeminal activity from signals arising in nearby structures.
Do not treat the approximate count of 60 sensory neurons as a universal number for every stage or preparation. It is a useful scale estimate for the larval trigeminal ganglion, not a substitute for cell identification. Your field of view may contain neurons at different developmental states, and not every neuron will respond to the same stimulus.
The assay becomes interpretable when developmental stage, stimulus geometry, and response metric are fixed before recording begins.
Build the anatomical reference first
Before applying a stimulus, acquire a stable anatomical image of the head. Use it to define:
1. The ganglion boundary.
2. The region of skin available for tactile stimulation.
3. The position of the eye, hindbrain, and major landmarks.
4. The region excluded from analysis because of poor focus, agarose obstruction, or movement.
5. The cells or regions of interest that will be tracked through the entire trial.
This is a mapping problem. If the region of interest changes between trials, the assay no longer compares responses. It compares fields of view.
For population imaging, define whether the unit of analysis is the individual neuron, the ganglion-wide response, or a spatially resolved map. These are different outputs. A ganglion-wide calcium increase can hide opposing responses in individual cells. A single-cell analysis can miss a coordinated population event.
Select the unit before you begin. Then apply it consistently.
2. Immobilize the larva without losing sensory access
Larval zebrafish are commonly prepared for optical recording or microelectrode array work by head-embedding or full immobilization in low-melting-point agarose. The choice depends on the stimulus.
Head embedding is useful when the body should retain some movement or when the experiment requires access to body or tail responses. Full immobilization gives better control for imaging and electrophysiological recording but places more constraints on stimulus delivery and interpretation.
The embedding procedure has two competing requirements:
- Stabilize the specimen enough to prevent motion artifacts.
- Keep the trigeminal receptive surface exposed and mechanically accessible.
If the agarose covers the head region that you intend to stimulate, the assay becomes a test of force transmission through the embedding matrix. That may be acceptable in a deliberately designed mechanical model. It is not acceptable if the goal is to compare direct skin stimulation across larvae.
A practical embedding sequence
Use a repeatable sequence rather than adjusting the preparation by eye for every specimen.
1. Prepare the low-melting-point agarose at a condition that remains workable during transfer.
2. Position the larva with the head and intended sensory surface aligned to the imaging plane.
3. Apply enough agarose to prevent rotation and translation.
4. Keep the trigeminal ganglion visible and the stimulation zone free of unnecessary material.
5. Allow the matrix to stabilize before collecting the baseline.
6. Confirm that respiration, orientation, and optical access remain acceptable.
7. Reject preparations that require repeated repositioning during the recording.
The exact agarose concentration, temperature, and volume must be calibrated to the local setup. These variables are not interchangeable between laboratories because they depend on dish geometry, imaging configuration, larval age, and the mechanical actuator.
Do not compensate for poor embedding by increasing stimulus strength. That confounds immobilization failure with sensory gain.
Head embedding versus full immobilization
| Parameter | Head embedding | Full immobilization |
|---|---|---|
| Head stability | Strong when the agarose collar is well formed | Strong across the preparation |
| Body movement | Partly retained | Suppressed |
| Optical recording | Suitable for head and ganglion imaging | Suitable for stable high-resolution imaging |
| Mechanical stimulation | Easier to direct toward the exposed head | Requires careful probe access |
| Behavioral interpretation | Some body or escape responses may remain | Motor output is largely unavailable |
| Main artifact | Residual specimen movement | Restricted physiology or inaccessible stimulation surface |
The table is not a ranking. It is a decision point. If the readout is neural activity in the ganglion, full immobilization may simplify the signal. If the readout includes behavior, it can remove the output you are trying to measure.
3. Establish a motion-free baseline before stimulation
A calcium trace is not automatically neural evidence. It can contain movement artifacts, focus shifts, illumination changes, bleaching, and delivery transients. The baseline must therefore be treated as a calibration interval, not dead time before the experiment begins.
Collect a stable pre-stimulus recording long enough to quantify:
- Baseline fluorescence.
- Baseline drift.
- Spontaneous activity.
- Residual movement.
- Focus stability.
- Signal variability within each region of interest.
For calcium imaging, define the baseline fluorescence from the same region and use the same calculation for every trial. A common approach is to express activity relative to baseline, such as a normalized fluorescence change. The exact formula should be fixed in the analysis plan rather than selected after seeing the traces.
Also record an anatomical or motion channel if the microscope permits it. A neural signal that appears only when the head shifts is a preparation problem, not a sensory result.
The baseline should answer one operational question: if no stimulus is delivered, does the preparation remain sufficiently stable to detect the expected response?
If the answer is no, stop there. Re-embed or exclude the specimen. Do not proceed and attempt to repair the trace mathematically.
4. Deliver tactile stimulation with controlled geometry
The tactile assay depends on force, location, timing, and contact geometry. A fine mechanical apparatus, including a platinum wire probe, can deliver controlled ramps or step impressions to the larval head. The probe is typically positioned with a starting distance of 100 µm from the skin before the stimulus is applied.
That distance is a useful default reference. It is not a complete stimulus specification. You still need to define:
- The approach direction.
- The contacted skin region.
- The displacement or indentation command.
- The ramp or step profile.
- The duration of contact.
- The interval between trials.
- The number of repeated presentations.
- The actuator’s return position.
Without these fields, “tactile stimulation” describes an intention rather than a reproducible input.
Calibrate the probe position
The probe should be visible relative to the larval head and skin. If the probe is not resolved in the imaging plane, a nominal 100 µm position can become a visual guess. That introduces lateral and vertical error.
Use the following sequence:
1. Locate the stimulation zone on the head.
2. Place the platinum wire approximately 100 µm from the skin.
3. Capture the initial position in the image.
4. Define the movement path before contacting the specimen.
5. Deliver the selected ramp or step.
6. Return the probe to the same reference position.
7. Allow the response and any mechanical disturbance to settle before the next trial.
The key measurement is not the commanded movement alone. It is the relationship between the commanded movement and the skin contact. Flexibility in the wire, drift in the actuator, and curvature of the larval surface can all change the delivered force.
If the setup measures force directly, record it. If it does not, standardize displacement and geometry as tightly as possible, then describe the input as a controlled indentation or displacement rather than as a known force.
Separate stimulus parameters
A tactile response can change because of at least four independent variables:
- Stimulus amplitude.
- Stimulus duration.
- Stimulus speed.
- Stimulus location.
Do not vary all four in one experiment. That produces a response matrix that cannot be interpreted. Start with one defined contact location and one stimulus profile. Once the preparation is stable, vary one parameter at a time.
A practical progression is:
1. Confirm that a reference stimulus produces a repeatable signal.
2. Repeat the reference stimulus to measure trial-to-trial stability.
3. Change amplitude while holding duration, speed, and location constant.
4. Restore the reference stimulus to test whether the preparation has drifted.
5. Only then examine a different location or temporal profile.
The return-to-reference trial is essential. It tells you whether the response changed because of the experimental variable or because the larva, imaging system, or probe changed over time.
Quantify response rather than display it
Use a response definition that can be applied across cells and larvae. Options include:
- Peak normalized fluorescence change.
- Response area over a fixed post-stimulus interval.
- Response onset latency.
- Fraction of neurons exceeding a predefined threshold.
- Spatial distribution of responsive neurons.
- Trial-to-trial correlation for the same cell or population.
Each metric answers a different question. Peak amplitude emphasizes response strength. Latency emphasizes timing. Responsive-cell fraction emphasizes recruitment. Spatial mapping emphasizes circuit organization.
Avoid selecting the most visually impressive trace. That is a selection rule, not an analysis method.
5. Isolate chemical activation from mechanical delivery
Trigeminal chemosensory transduction in zebrafish can involve ion channels such as TrpA1b. Chemical agonists including allyl isothiocyanate, commonly known as mustard oil, can be used to activate relevant sensory pathways. This creates a useful contrast with tactile stimulation, but it also introduces an additional technical problem: the delivery system can stimulate the preparation mechanically or alter the local environment independently of the agonist.
The central control is vehicle delivery. Apply the delivery solution without the active compound using the same route and timing. If the vehicle produces a response, the assay has not isolated chemical activation.
Define the delivery event
A chemical trial should specify:
- The active compound and concentration.
- The delivery volume or flow condition, if measured.
- The route of application.
- The onset and duration of exposure.
- The washout procedure.
- The interval before the next trial.
- The region and cells used for analysis.
Do not assume that a response to allyl isothiocyanate means every trigeminal neuron is TrpA1b-positive. Neurons differ by subtype and developmental state. A population response can reflect recruitment of a subset rather than uniform activation.
The same logic applies to negative results. A weak or absent response may indicate low receptor expression, poor delivery, inadequate exposure, or a mismatch between developmental stage and pathway maturation. The assay must distinguish these possibilities with controls.
Keep tactile and chemical trials separate
Do not alternate mechanical and chemical stimuli without a recovery plan. Chemical exposure can change excitability, trigger adaptation, or alter the tissue environment. Mechanical contact can shift the larva or probe position. Mixing modalities too quickly makes the order of trials a hidden experimental variable.
Use a defined sequence and keep it constant across specimens. For example:
1. Baseline imaging.
2. Reference tactile stimulus.
3. Recovery recording.
4. Vehicle delivery.
5. Recovery recording.
6. Chemical agonist delivery.
7. Extended post-stimulus recording.
8. Final anatomical image.
The precise order can change with the scientific question. The requirement does not: document the order and preserve it across the dataset.
Chemical activation is only interpretable after the delivery event itself has been tested as a possible stimulus.
Do not collapse trigeminal and olfactory pathways
The trigeminal ganglion is a somatosensory structure. It is not the olfactory system, and its neurons are not identical to olfactory sensory neurons. Both systems can contribute to the perception of environmental chemicals, but they use different anatomical routes and sensory logic.
This distinction matters when interpreting chemical responses. A response in the trigeminal ganglion can indicate chemesthetic or irritant-related signaling rather than odorant perception through the olfactory epithelium and olfactory bulb.
Keep the claim matched to the preparation. If the readout is trigeminal activity, report trigeminal activation. Do not label it broadly as olfactory processing.
6. Integrate calcium imaging with the stimulus timeline
Calcium imaging provides spatial access to the ganglion. It can show which neurons respond, when they respond, and whether a stimulus recruits a local or distributed pattern. It does not directly report membrane voltage or synaptic transmission. The signal is an indirect activity measure and must be interpreted through the timing and kinetics of the indicator.
The recording timeline should therefore be explicit. Mark at least:
- Start and end of baseline.
- Probe approach.
- Skin contact or displacement onset.
- Stimulus offset.
- Chemical delivery onset and offset.
- Washout or recovery interval.
- Any focus adjustment or acquisition interruption.
A response trace without event markers is difficult to audit. The event markers allow you to separate fast mechanical artifacts from delayed neural signals and to compare latency across stimulus types.
Map individual neurons before averaging
Population averages are useful for overview. They are weak as a first analysis. Begin with single-cell traces, then aggregate.
For each neuron, quantify:
- Baseline stability.
- Peak activity after stimulus onset.
- Latency to response.
- Duration of the response.
- Trial reliability.
- Response to vehicle or sham stimulation.
- Response across tactile and chemical conditions.
Then construct the population summary. This order protects against a common failure: a small number of strongly responding cells dominating the average while the rest of the ganglion remains inactive.
Spatial mapping adds another layer. Plot responsive cells relative to the ganglion boundary and anatomical landmarks. A response map can reveal whether tactile and chemical stimuli recruit overlapping populations or distinct zones. It can also expose a simpler explanation: the apparent difference is caused by uneven imaging quality across the field.
Use electrophysiology or MEA when timing is central
The preparation can also support electrophysiological recordings, including microelectrode array approaches, when the question requires faster temporal resolution or a readout less dependent on calcium kinetics.
The same mechanical controls still apply. Immobilization must prevent movement without obscuring the relevant sensory surface. Stimulus timing must be synchronized with acquisition. Baseline noise must be quantified before applying the stimulus.
Do not treat calcium imaging and electrophysiology as interchangeable measurements. They can converge on the same sensory event, but their temporal resolution, noise structure, and biological interpretation differ.
7. Design controls that isolate the actual failure point
A strong larval zebrafish trigeminal assay setup does not rely on one positive response. It uses controls to identify where the signal enters the system.
At minimum, include controls for:
- No-stimulus baseline.
- Mechanical sham or probe movement without effective skin contact.
- Vehicle delivery.
- Repeated reference stimulus.
- Anatomical stability.
- Imaging drift and bleaching.
- Developmental-stage consistency.
A probe movement control is particularly valuable. Move the probe through the same path while stopping short of the skin, or use a sham trajectory that reproduces actuator motion without the intended indentation. If the neural trace follows probe movement rather than skin contact, the apparatus or fluid disturbance is contributing to the signal.
For chemical delivery, the vehicle control should reproduce the same pressure, flow, timing, and exposure route. A different delivery pattern is not a control. It is a second stimulus.
A compact troubleshooting matrix
| Observation | Likely bottleneck | First parameter to isolate |
|---|---|---|
| Signal begins when the probe moves, before contact | Mechanical or optical artifact | Probe trajectory and motion channel |
| Responses vary with larval orientation | Inconsistent contact geometry | Head angle and stimulation location |
| Vehicle produces a calcium transient | Delivery artifact or environmental change | Flow, pressure, timing, and vehicle composition |
| Baseline drifts throughout the recording | Bleaching, focus shift, or physiological instability | Baseline fluorescence and image registration |
| Chemical responses appear in only a subset of cells | Cell subtype or developmental difference | Single-cell response map and stage control |
| Repeated tactile responses decline | Adaptation, tissue displacement, or probe drift | Inter-trial interval and return-to-reference trial |
| No response despite stable imaging | Poor stimulus access or pathway mismatch | Skin exposure, agonist delivery, and developmental stage |
| Population average is strong but individual traces are inconsistent | A few cells dominate the signal | Cell-level response threshold and distribution |
This matrix is not a replacement for analysis. It is a way to choose the next measurement instead of changing several conditions at once.
8. Build the final protocol around measurable handoffs
A reproducible assay is a chain of handoffs. Each step must leave the next step with a defined input.
Handoff 1: stage to anatomy
The larva enters the experiment with a recorded developmental stage. The ganglion is localized relative to the eye and anterior hindbrain. The imaging field is accepted or rejected before stimulation.
Handoff 2: anatomy to immobilization
The head is aligned. The intended skin region remains accessible. The larva does not rotate or translate during baseline acquisition.
Handoff 3: immobilization to stimulus
The probe or chemical delivery route is visible. The reference position is recorded. Stimulus timing is synchronized with acquisition.
Handoff 4: stimulus to response
The analysis window, baseline method, and response threshold are fixed. Vehicle, sham, or no-stimulus trials are available for comparison.
Handoff 5: response to interpretation
The claim stays within the pathway measured. A trigeminal response is reported as trigeminal activity. A TrpA1b-linked chemical response is not generalized to all trigeminal neurons. A calcium transient is not described as a direct spike count unless supported by an appropriate calibration.
This structure keeps the assay useful when the first experiment does not produce a clean result. You can identify the failed handoff instead of discarding the entire preparation.
The strict operating checklist
Before accepting a dataset, confirm the following:
1. The larvae were assigned to a defined developmental window.
2. The trigeminal ganglion was identified anatomically in each usable preparation.
3. The ganglion remained visible and stable throughout recording.
4. The larva was immobilized without blocking the intended receptive surface.
5. The probe position was recorded, with approximately 100 µm used as the initial reference distance where appropriate.
6. The mechanical stimulus profile was defined by location, movement, timing, and return position.
7. Chemical exposure included a vehicle control delivered through the same route.
8. Calcium or electrophysiological acquisition was synchronized to stimulus events.
9. Motion, bleaching, and baseline drift were measured rather than assumed absent.
10. Single-cell responses were inspected before population averaging.
11. Repeated reference trials were used to detect adaptation and preparation drift.
12. The final interpretation was limited to the trigeminal pathway and stimulus modality actually measured.
The practical endpoint is simple. You should be able to state exactly what changed in the larva, when it changed, where the signal appeared, and which control excluded a technical explanation.
If those four answers are not available, the assay is not yet mapped. Return to the bottleneck: stage, embedding, stimulus geometry, delivery, or readout. Calibrate one parameter. Repeat the reference condition. Then move forward.